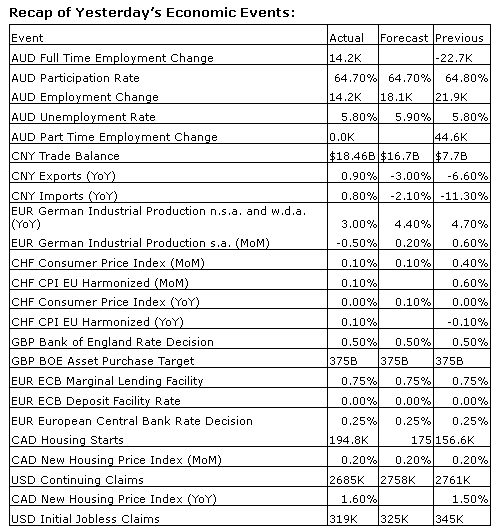
Upcoming US Events for Today:- Job Openings and Labor Turnover Survey for March will be released at 10:00am. The market expects 4.125M versus 4.173M previous.
- Wholesale Trade for March will be released at 10:00am. The market expects a month-over-month increase of 0.5%, consistent with the previous report.
Upcoming International Events for Today:
- German Merchandise Trade for March will be released at 2:00am EST. The market expects 15.8B versus 15.7B previous.
- Great Britain Industrial Production for March will be released at 4:30am EST. The market expects a year-over-year increase of 2.4% versus an increase of 2.7% previous.
- Great Britain Merchandise Trade for March will be released at 4:30am EST.
- Canadian Labour Force Survey for April will be released at 8:30am EST. The market expects employment to increase by 16,300 versus 42,900 previous. The Unemployment Rate is expected to hold steady at 6.9%.
The Markets
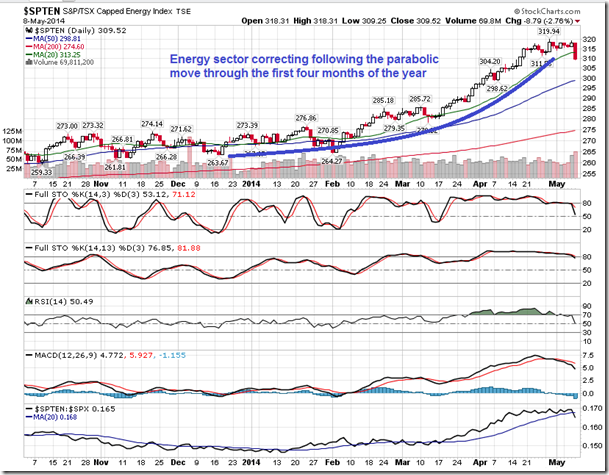
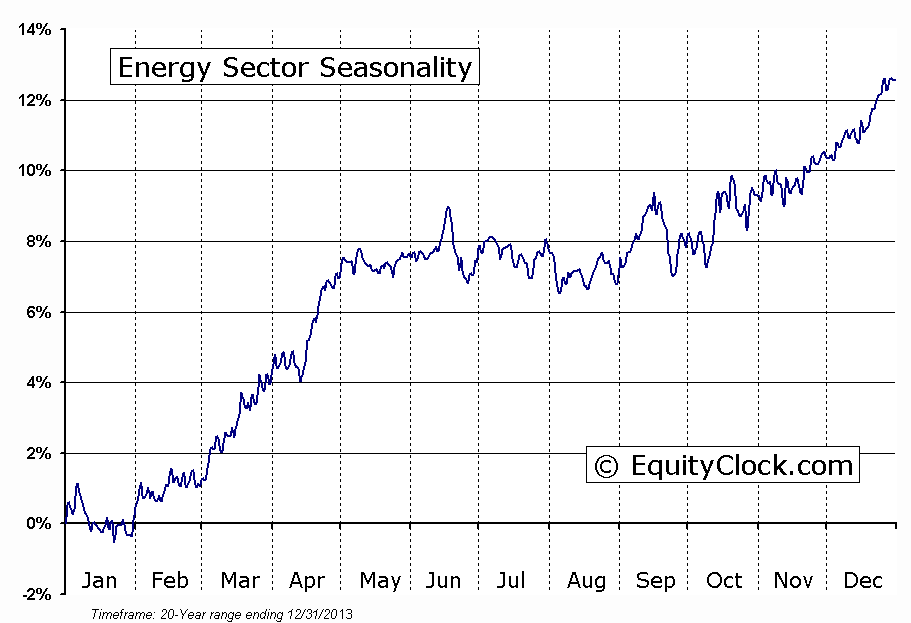
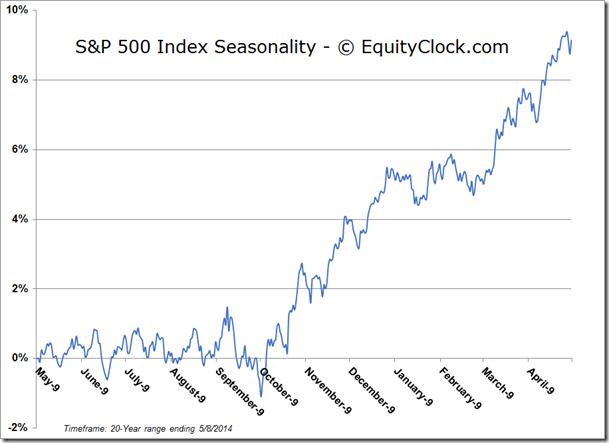
Stocks reversed earlier gains on Thursday as weakness in the Energy and Utilities sectors acted as a strain on broad market indices. Investors were found to be booking profits in the two strongest sectors, year-to-date, as selling pressures start to show signs of spreading from momentum names to allocations that have recorded gains in the midst of the stagnant broad market returns over recent months. Energy stocks, particularly in Canada, had gone parabolic since the year began, making them vulnerable to abrupt declines should selling pressures emerge. The energy sector concludes its spring seasonal run at this time of year, the result of which has been significant, gaining around 15% since the period of seasonal strength began at the beginning of February; average seasonal gains between the end of January and the beginning of May run around 8%. The next period of seasonal strength for energy stocks runs from July through to October, attributed to the summer driving season.
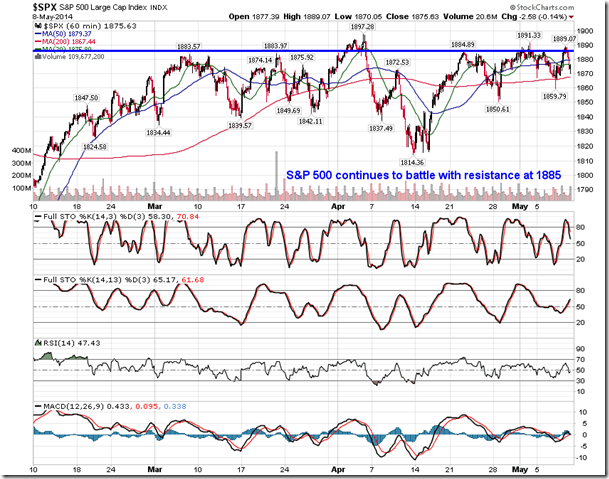
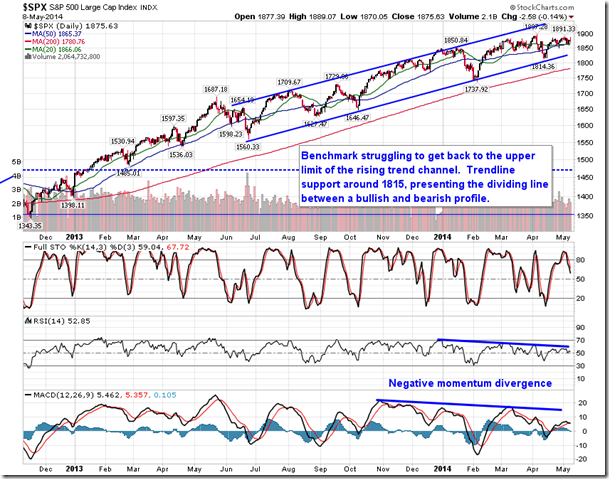
Thursday’s reversal confirmed the continued resistance for the S&P 500 Index around 1885, a level that the benchmark has stalled at for over two months.
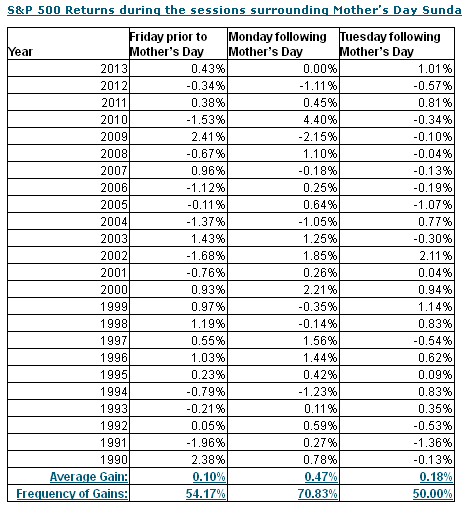
This weekend is Mother’s Day, a day to show your appreciation to those women that brought you in to this world. Mom’s appreciate it and it appears that the equity markets do as well with the S&P 500 showing gains 71% of the time during the Monday that follows since 1990. Gains for the large-cap index average a respectable 0.47%. The frequency for gains during the Friday prior and the Tuesday following the upbeat Monday are a less than stellar 54% and 50%, respectively, making the Mother’s Day “bump” an isolated event. Happy Mother’s Day!
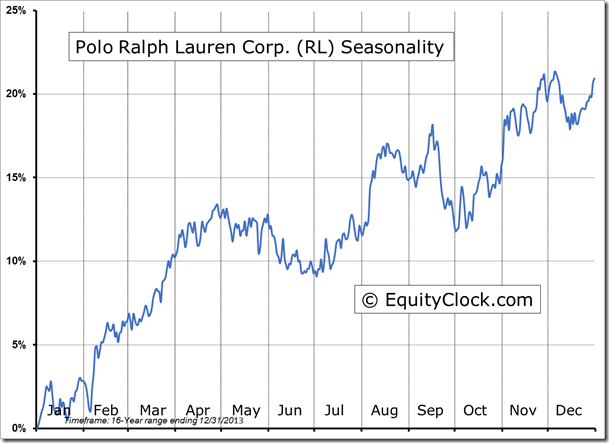
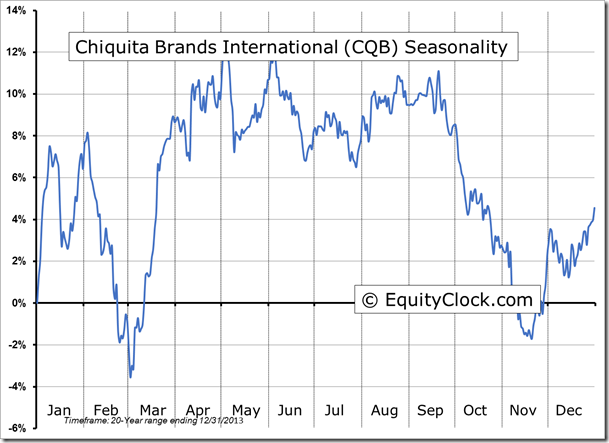
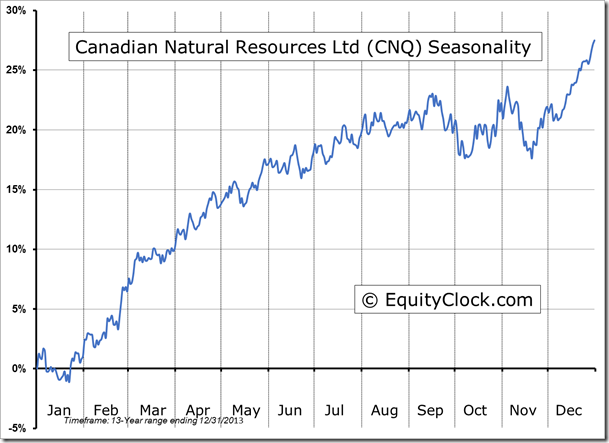
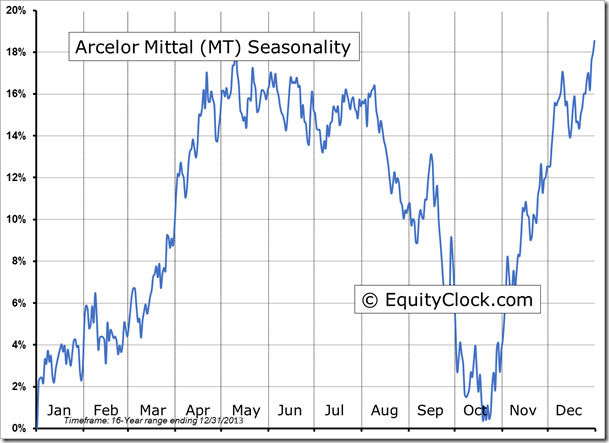
Seasonal charts of companies reporting earnings today:
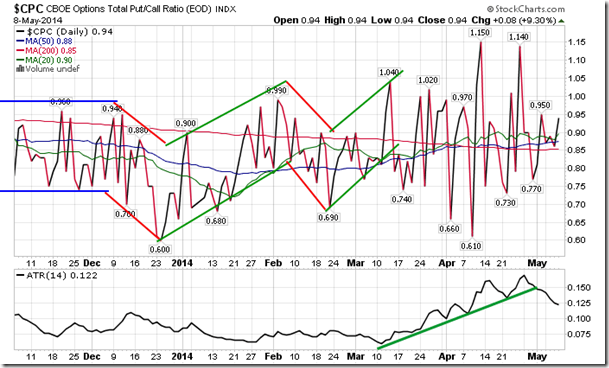
Sentiment on Thursday, as gauged by the put-call ratio, ended bullish at 0.94.
S&P 500 Index
TSE Composite
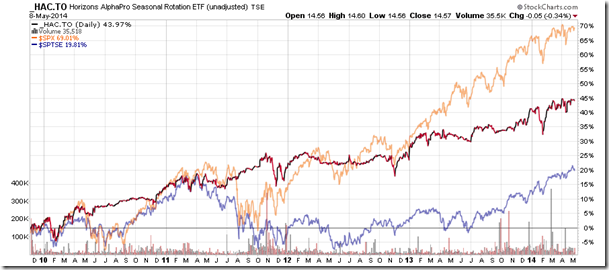
Horizons Seasonal Rotation ETF (TO:HAC)
- Closing Market Value: $14.57 (down 0.34%)
- Closing NAV/Unit: $14.57 (down 0.30%)
Performance*
| 2014 Year-to-Date | Since Inception (Nov 19, 2009) | |
| HAC.TO | 1.89% | 45.7% |
* performance calculated on Closing NAV/Unit as provided by custodian

