Upcoming US Events for Today:
- Quadruple Witching
Upcoming International Events for Today:
- Canadian CPI for February will be released at 8:30am EST. The market expects a year-over-year increase of 0.9% versus an increase of 1.5% previous.
- Retail Sales for January will be released at 8:30am EST. The market expects a month-over-month increase of 0.7% versus a decline of 1.8% previous.
- Euro-Zone Consumer Confidence for March will be released at 11:00am EST. The market expects –12.3 versus –12.7 previous.
The Markets
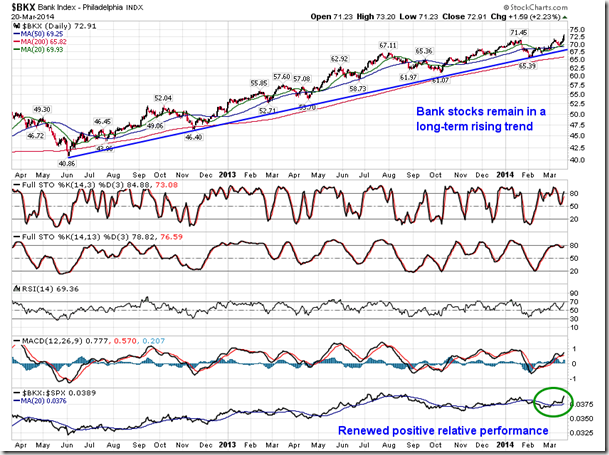
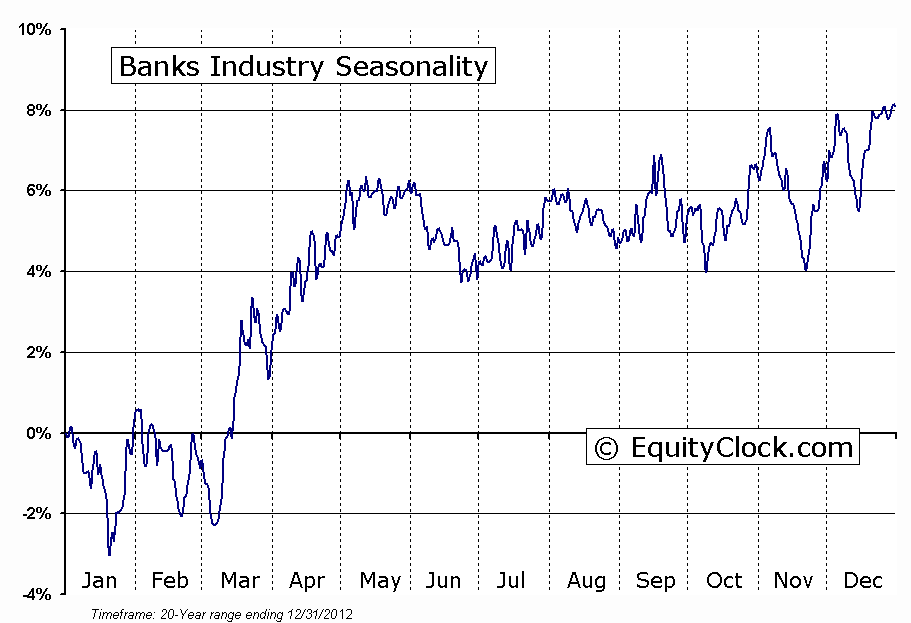
Stocks rebounded on Thursday as investors continued to digest Wednesday’s FOMC announcement. Financial and Technology stocks, two of the largest constituents in the S&P 500 Index, led the gains on the session. The Philadelphia Bank Index jumped for a second day, returning 2.23%, as investors allocated portfolios with the prospect of looming Fed rate hikes in mind. Investors were also looking forward to the Fed’s Bank Stress Tests that were reported after the closing bell. The results showed that 29 of the 30 banks tested have sufficient capital levels to withstand adverse economic conditions, including a drop in house prices and a surge in unemployment. Investors believe that this will now open the door for dividend increases and share buybacks, which in the case of some banks remains long overdue. First quarter earnings season begins in a few weeks and banks are notorious for announcing these type of corporate actions during this period. Bank stocks remain seasonally strong through March and April.
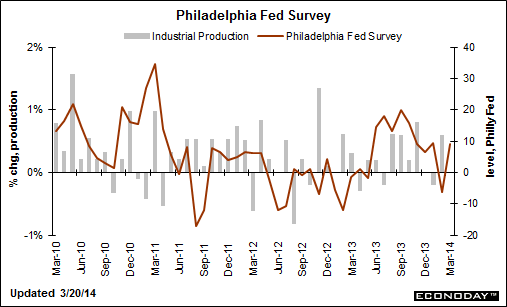
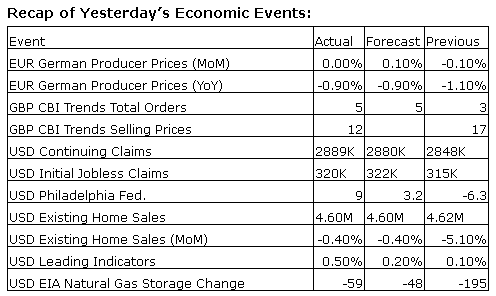
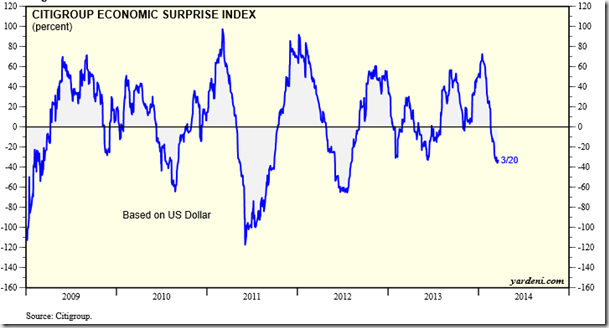
Yesterday, Spring began, marking the end to one of the coldest and snowiest Winter’s on record. Economic data since the start of the year has been impacted, causing a number of reports to miss analyst estimates due to the unforeseen strain that the weather has had on the economy. As a result, the Citigroup Economic Surprise index remains depressed around the lowest levels in years. Now, some of the first “clean” reports, excluding the inclement winter weather, are being released. The Philadelphia Fed Index, a reasonable gauge of manufacturing/economic activity in the US Northeast, reported on Thursday that Business Conditions for March expanded more than expected. Strength in New Orders and Shipments helped lift the index from the February low of –6.3 to +9.0 for March; analysts expected a read of +3.0. Manufacturing seasonally gains into the Spring months, picking up after a typical winter slowdown; Thursday’s report suggests that we’re already off to a good start. Industrial and Material stocks tend to benefit from the manufacturing surge through to the start of May.
Today is Quadruple Witching, the day in which stock index futures, stock index options, stock options, and single stock futures are set to expire. With the S&P 500 on track to realize a positive result for the week, a typical occurrence for the March Quadruple Witching week, the outlook for the week that follows isn’t as quite upbeat. Over the past 20 years, the average return for the S&P 500 was 0.24%, however, only 7 of the past 20 periods recorded a positive result. The period is deemed the “witches hangover” whereby the positive results attributed to the settlement of open option and futures contracts are reversed following the expiration date. With March’s expiration date occurring later than usual this year, the negative tendencies surrounding witches hangover will have to battle with positive month-end tendencies given that next week is the last full week of the month and quarter. Positive results between expiration Friday and the end of March have been realized in 12 of the past 20 periods.
| S&P 500 Index Returns surrounding Quadruple Witching | |||
| March Quadruple Witching Week | Week Following Quadruple Witching | Quadruple Witching to Month-End | |
| 2013 | 0.61% | -0.24% | 0.54% |
| 2012 | 2.43% | -0.50% | 0.31% |
| 2011 | -1.92% | 2.70% | 3.83% |
| 2010 | 0.86% | 0.58% | 1.15% |
| 2009 | 1.58% | 6.17% | 2.47% |
| 2008 | 3.21% | -1.07% | -1.07% |
| 2007 | -1.13% | 3.54% | 2.44% |
| 2006 | 2.02% | -0.33% | -0.54% |
| 2005 | -0.87% | -1.53% | -0.69% |
| 2004 | -0.96% | -0.15% | 1.55% |
| 2003 | 7.50% | -3.60% | -3.60% |
| 2002 | 0.16% | -1.50% | -1.61% |
| 2001 | -6.72% | -0.93% | 0.85% |
| 2000 | 4.97% | 4.30% | 1.60% |
| 1999 | 0.36% | -1.27% | 0.11% |
| 1998 | 2.86% | -0.34% | -0.51% |
| 1997 | -1.14% | -1.30% | -1.30% |
| 1996 | 1.25% | 1.43% | 0.63% |
| 1995 | 1.22% | 1.10% | 1.35% |
| 1994 | 0.99% | -2.22% | -5.42% |
| Average | 0.86% | 0.24% | 0.11% |
| Positive Periods | 14 | 7 | 12 |
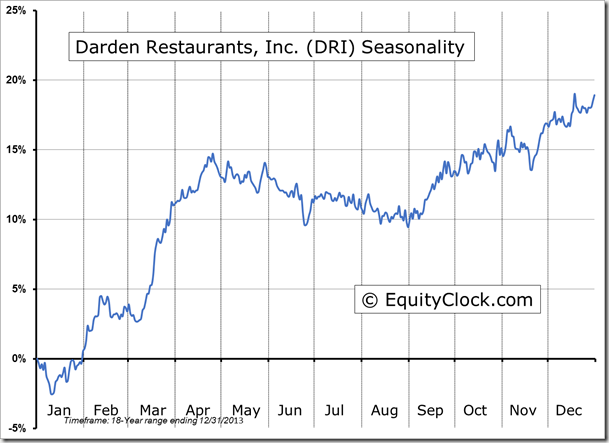
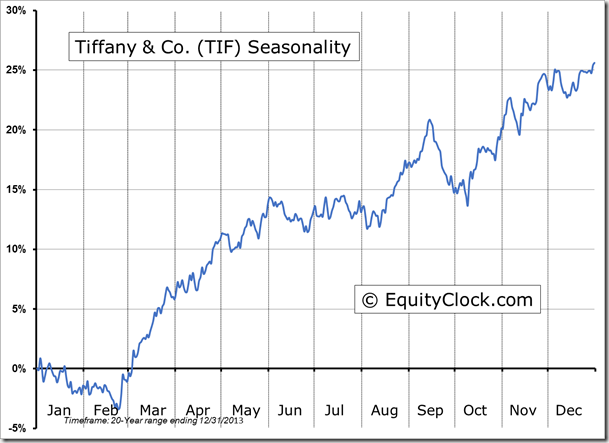
Seasonal charts of companies reporting earnings today:
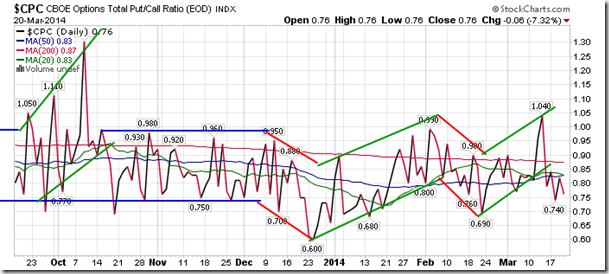
Sentiment on Thursday, as gauged by the put-call ratio, ended bullish at 0.76.
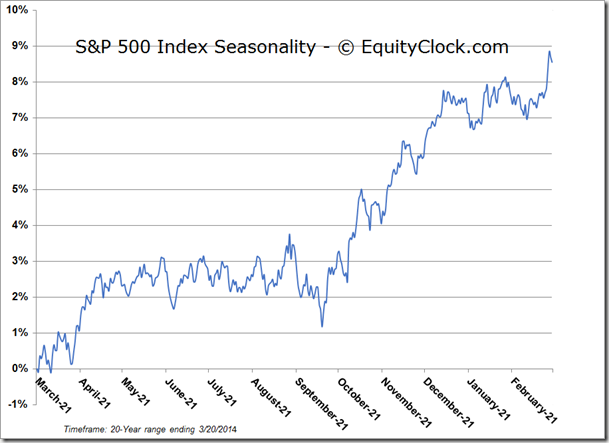
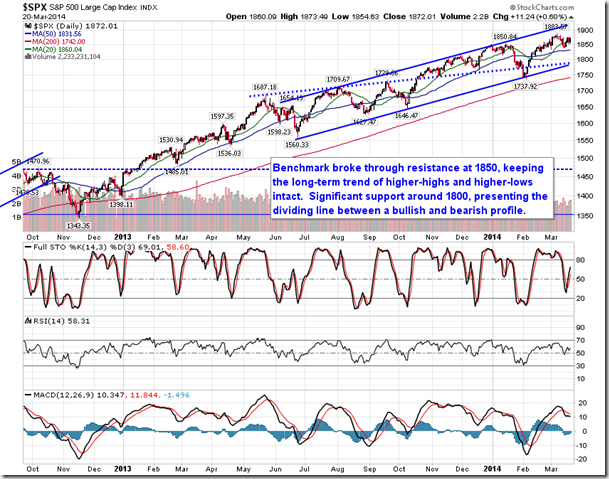
S&P 500 Index
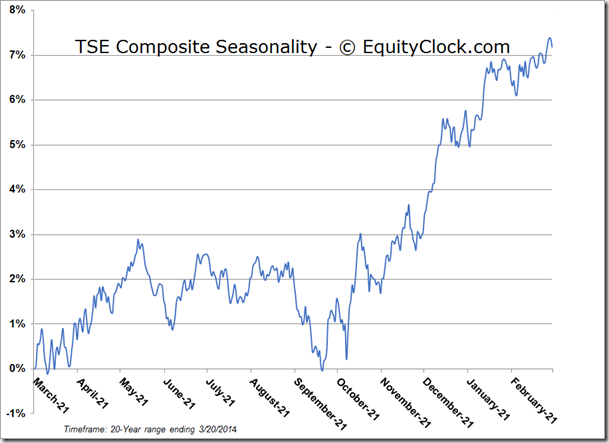
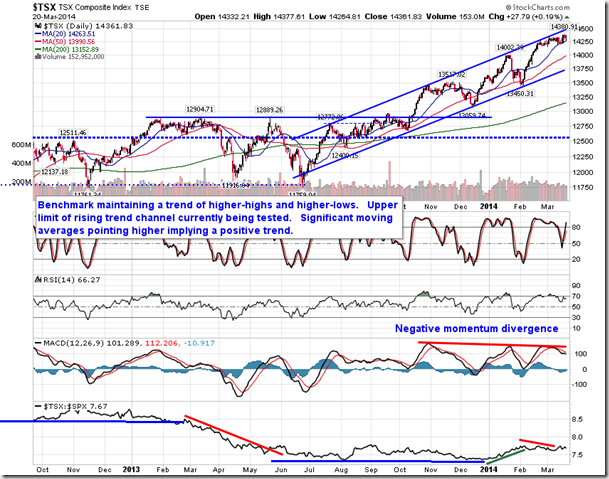
TSE Composite
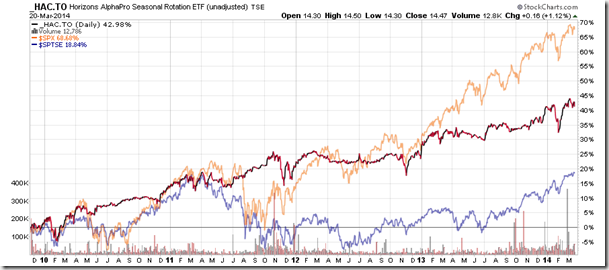
Horizons Seasonal Rotation ETF (HAC)
- Closing Market Value: $14.47 (up 1.12%)
- Closing NAV/Unit: $14.45 (up 0.14%)
Performance*
| 2014 Year-to-Date | Since Inception (Nov 19, 2009) | |
| HAC.TO | 1.05% | 44.5% |
* performance calculated on Closing NAV/Unit as provided by custodian

