Upcoming US Events for Today:
- Personal Income and Spending for December will be released at 8:30am. The market expects Personal Income to increase by 0.2% month-over-month, consistent with the previous report. Consumer Spending is expected to increase by 0.2% month-over-month versus an increase of 0.5% previous.
- Employment Cost Index for the Fourth Quarter will be released at 8:30am. The market expects a quarter-over-quarter increase of 0.4%, consistent with the previous report.
- Chicago PMI for January will be released at 9:45am. The market expects 59.5 versus 59.1 previous.
- Consumer Sentiment for January will be released at 9:55am. The market expects 81.0 versus 80.4 previous.
Upcoming International Events for Today:
- German Retail Sales for December will be released at 2:00am EST. The market expects a year-over-year increase of 2.5% versus an increase of 1.6% previous.
- Euro-Zone Flash CPI for January will be released at 5:00am EST. The market expects a year-over-year increase of 0.9% versus an increase of 0.8% previous.
- Euro-Zone Unemployment Rate for December will be released at 5:00am EST. The market expects 12.1%, consistent with the previous report.
- Canadian Monthly GDP for November will be released at 8:30am EST. The market expects a year-over-year increase of 2.6% versus an increase of 2.7% previous.
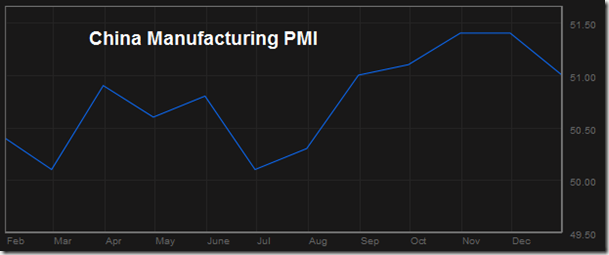
- China Manufacturing PMI for January will be released at 8:00pm EST. The market expects 50.5 versus 51.0 previous.
Recap of Yesterday’s Economic Events:
| Event | Actual | Forecast | Previous |
| CNY HSBC/Markit Manufacturing PMI | 49.5 | 49.6 | 50.5 |
| EUR German Unemployment Rate s.a. | 6.80% | 6.90% | 6.90% |
| EUR German Unemployment Change | -28K | -5K | -19K |
| EUR Euro-Zone Economic Confidence | 100.9 | 101 | 100.4 |
| EUR Euro-Zone Consumer Confidence | -11.7 | -11.7 | -11.7 |
| EUR Euro-Zone Services Confidence | 2.3 | 0.8 | 0.4 |
| EUR Euro-Zone Industrial Confidence | -3.9 | -2.9 | -3.4 |
| EUR Euro-Zone Business Climate Indicator | 0.19 | 0.35 | 0.2 |
| EUR German Consumer Price Index (YoY) | 1.30% | 1.50% | 1.40% |
| EUR German Consumer Price Index – EU Harmonised (MoM) | -0.70% | -0.60% | 0.50% |
| EUR German Consumer Price Index (MoM) | -0.60% | -0.40% | 0.40% |
| EUR German Consumer Price Index – EU Harmonised (YoY) | 1.20% | 1.30% | 1.20% |
| USD Gross Domestic Product (Annualized) | 3.20% | 3.20% | 4.10% |
| USD Gross Domestic Product Price Index | 1.30% | 1.20% | 2.00% |
| USD Personal Consumption | 3.30% | 3.70% | 2.00% |
| USD Core Personal Consumption Expenditure (QoQ) | 1.10% | 1.10% | 1.40% |
| USD Initial Jobless Claims | 348K | 330K | 329K |
| USD Continuing Claims | 2991K | 3000K | 3007K |
| USD Pending Home Sales (MoM) | -8.70% | -0.30% | -0.30% |
| USD Pending Home Sales (YoY) | -6.10% | -0.30% | -4.40% |
| USD EIA Natural Gas Storage Change | -230 | -231 | -107 |
| NZD Trade Balance (New Zealand dollars) | 523M | 500M | 183M |
| JPY Jobless Rate | 3.70% | 3.90% | 4.00% |
| JPY Job-To-Applicant Ratio | 1.03 | 1.01 | 1 |
| JPY National Consumer Price Index Ex-Fresh Food (YoY) | 1.30% | 1.20% | 1.20% |
| JPY National Consumer Price Index Ex Food, Energy (YoY) | 0.70% | 0.70% | 0.60% |
| JPY National Consumer Price Index (YoY) | 1.60% | 1.50% | 1.50% |
| JPY Nomura/JMMA Manufacturing Purchasing Manager Index | 56.6 | 55.2 | |
| JPY Industrial Production (MoM) | 1.10% | 1.30% | -0.10% |
| JPY Industrial Production (YoY) | 7.30% | 7.30% | 4.80% |
The Markets
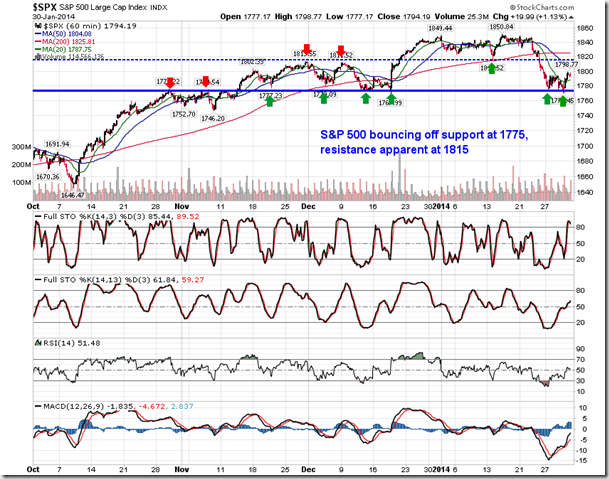
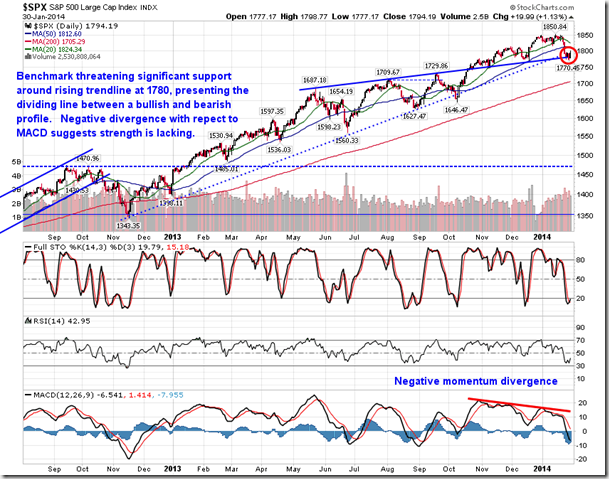
Stocks surged on Thursday, buoyed by a stronger than expected report on GDP. GDP rose 3.2% for the fourth quarter, benefiting from strength in private sector spending. The result exceeded estimates calling for an increase of 3.0%. The S&P 500 Index ended higher by 1.13%, while the NASDAQ gained 1.77%, fuelled by strength in health care and biotech stocks. Support for the S&P 500 continues to hold at 1775; resistance can be found at 1815, which represents support from the early January low and resistance from the late November/early December peaks. The trading pattern from November through to present is already leading some analysts to speculate of a massive head-and-shoulders pattern. With the neckline at 1775 and the recent peak at 1850, the downside target would point to 1700, which would lead to a test of the 200-day moving average sitting around the same level. However, it remains premature to speculate that a head-and-shoulders pattern is in play; confirmation of a lower-high is still required.
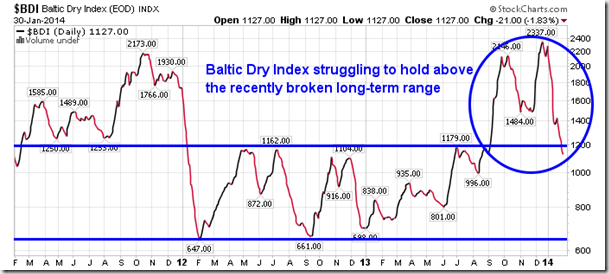
A leading indicator of global economic strength is showing signs of struggle. The Baltic Dry Index (BDI) revealed a significant breakout above a long-term range in September of last year, providing a leading indication of strength in the manufacturing sector around the globe, including China, which hit a 12-month high in October and November of 51.5, according to the seasonally adjusted data. The recent report from HSBC pertaining to the manufacturing sector in China shows a shift from expansion to contraction, coinciding with the declines in the BDI. As mentioned previously, declines in manufacturing activity leading into the Chinese New Year are typical, which could explain the recent data points; a trend cannot be concluded as of yet. Manufacturing activity typically picks up after the holiday.
This weekend is the Super Bowl, which has led to discussions pertaining to the so-called “Super Bowl Indicator.” We published an article titled “Pay little attention to these stock market myths” in the Globe and Mail yesterday discussing this and other market indicators. Average performance of the S&P 500 Index following an AFC win was 4.3%, with 63.6% of years showing a positive result, while the index gained 10.5% following an NFC win, with 80% of years showing a positive outcome. The indicator always captures media attention around this time of year, but the lack of a “cause and effect” relationship it has on equity prices puts this indicator in the category of being a myth. Perhaps having more of a “cause and effect” relationship is the tendency for declines the day following the big game. The S&P 500 has shown declines nearly 62% of the time the day following Super Bowl Sunday; average loss for the benchmark is a mere 0.1%. Surveys have shown that employees are more likely to waste time or call in sick on the Monday following the Super Bowl than any other day.
| S&P 500 Index Performance following Super Bowl | |
| Winning Conference | Return |
| AFC | 22.15% |
| NFC | 6.04% |
| NFC | -4.06% |
| NFC | 17.96% |
| AFC | 35.02% |
| NFC | -35.27% |
| AFC | 1.38% |
| AFC | 12.20% |
| AFC | 3.76% |
| AFC | 7.14% |
| NFC | 29.08% |
| AFC | -21.60% |
| AFC | -15.27% |
| NFC | -2.93% |
| AFC | 14.82% |
| AFC | 28.37% |
| NFC | 25.94% |
| NFC | 19.16% |
| NFC | 30.94% |
| NFC | -4.06% |
| NFC | 6.31% |
| NFC | 4.87% |
| NFC | 24.11% |
| NFC | 1.36% |
| NFC | 23.29% |
| NFC | 8.03% |
| NFC | -8.52% |
| NFC | 17.31% |
| NFC | 23.32% |
| AFC | 0.62% |
| NFC | 14.13% |
| NFC | 21.89% |
| AFC | -5.90% |
| AFC | 22.23% |
| AFC | 8.21% |
| NFC | 7.16% |
| AFC | -9.44% |
| AFC | 10.78% |
| AFC | 24.21% |
| AFC | -26.80% |
| AFC | -18.23% |
| NFC | 14.18% |
| AFC | 9.74% |
| AFC | -0.27% |
| AFC | -8.79% |
| NFC | 7.38% |
| NFC | 14.13% |
| Average Return: | 7.58% |
Super Bowl Sunday is also Groundhog Day, so we ran some stats on stock market returns during the session following Punxsutawney Phil’s prediction of either an early spring or a long winter. With an extremely cold winter thus far, everyone is hoping that the groundhog doesn’t see his shadow, indicating an early spring. Perhaps the moment of optimism that follows an “early spring" prediction creates a jovial atmosphere on Wall Street, because the S&P 500 Index has recorded gains during the session following an “early spring” prediction 77% of the time for an average gain of 0.27%; a “long-winter” prediction shows no significant outcomes with 53% of sessions showing a positive result for an average gain of 0.03%. Keep in mind, however, that the number of “long winter” predictions significantly outnumber “early spring” predictions, reducing the significance of the “early spring” result due to the insufficient sample size.
| Session Following Groundhog Prediction of "Long Winter" | One-day Return | Session Following Groundhog Prediction of "Early Spring" | One-Day Return |
| 2-02-12 | 0.11% | 2-04-13 | -1.15% |
| 2-02-10 | 1.30% | 2-02-11 | -0.27% |
| 2-02-09 | -0.05% | 2-02-07 | 0.17% |
| 2-04-08 | -1.05% | 2-02-99 | -0.86% |
| 2-02-06 | -0.91% | 2-03-97 | 0.07% |
| 2-02-05 | 0.32% | 2-02-95 | 0.51% |
| 2-02-04 | 0.37% | 2-02-90 | 0.65% |
| 2-03-03 | 0.54% | 2-02-88 | 0.21% |
| 2-04-02 | -2.47% | 2-03-86 | 1.03% |
| 2-02-01 | -1.75% | 2-02-83 | 0.19% |
| 2-02-00 | -0.01% | 2-03-75 | 1.09% |
| 2-02-98 | 2.14% | 2-02-70 | 0.86% |
| 2-02-96 | -0.41% | 2-02-50 | 1.06% |
| 2-02-94 | 0.50% | Average Return: | 0.27% |
| 2-02-93 | 0.01% | Frequency of Gains: | 76.92% |
| 2-03-92 | 0.18% | ||
| 2-04-91 | 1.54% | ||
| 2-02-89 | -0.08% | ||
| 2-02-87 | 0.86% | ||
| 2-04-85 | 0.96% | ||
| 2-02-84 | 0.38% | ||
| 2-02-82 | 0.20% | ||
| 2-02-81 | -2.04% | ||
| 2-04-80 | -0.65% | ||
| 2-02-79 | -0.46% | ||
| 2-02-78 | 0.22% | ||
| 2-02-77 | -0.18% | ||
| 2-02-76 | 0.01% | ||
| 2-04-74 | -2.13% | ||
| 2-03-73 | -0.36% | ||
| 2-02-72 | 0.64% | ||
| 2-02-71 | 0.01% | ||
| 2-03-69 | -0.12% | ||
| 2-02-68 | -0.31% | ||
| 2-02-67 | 0.35% | ||
| 2-02-66 | 0.40% | ||
| 2-02-65 | -0.03% | ||
| 2-03-64 | -0.09% | ||
| 2-04-63 | -0.21% | ||
| 2-02-62 | 0.79% | ||
| 2-02-61 | 0.65% | ||
| 2-02-60 | 1.54% | ||
| 2-02-59 | -0.43% | ||
| 2-03-58 | 0.82% | ||
| 2-04-57 | -0.20% | ||
| 2-02-56 | 0.43% | ||
| 2-02-55 | -0.30% | ||
| 2-02-54 | -0.27% | ||
| 2-02-53 | 0.49% | ||
| 2-04-52 | -0.74% | ||
| 2-02-51 | 0.87% | ||
| Average Return: | 0.03% | ||
| Frequency of Gains: | 52.94% |
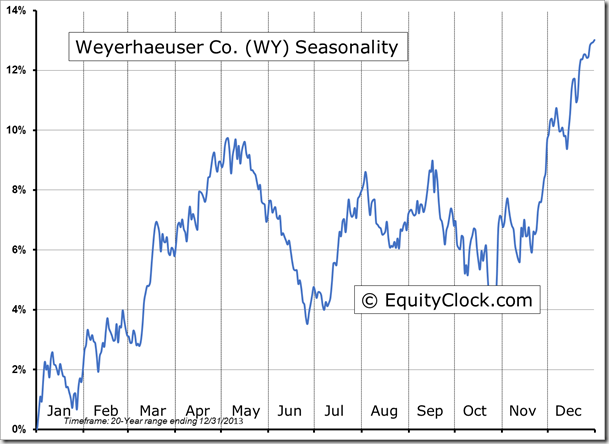
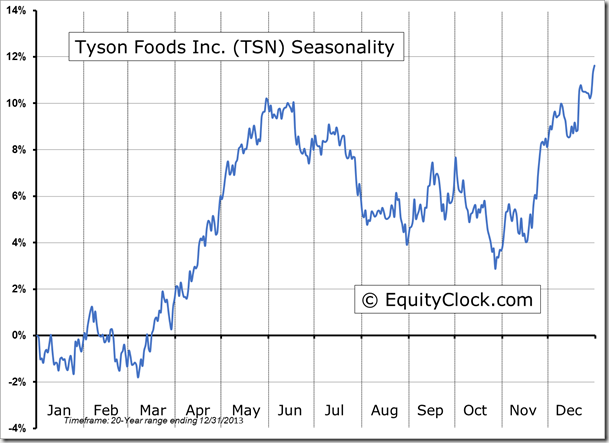
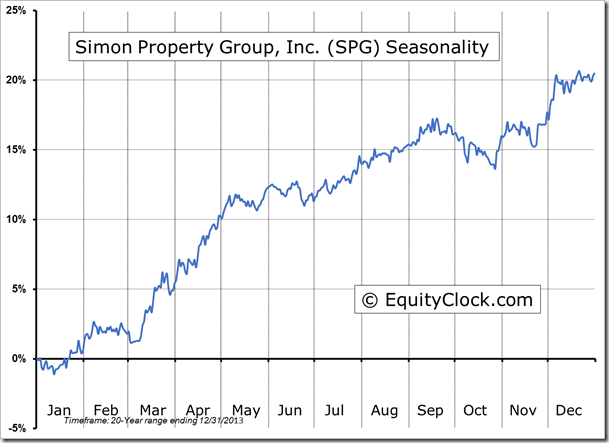
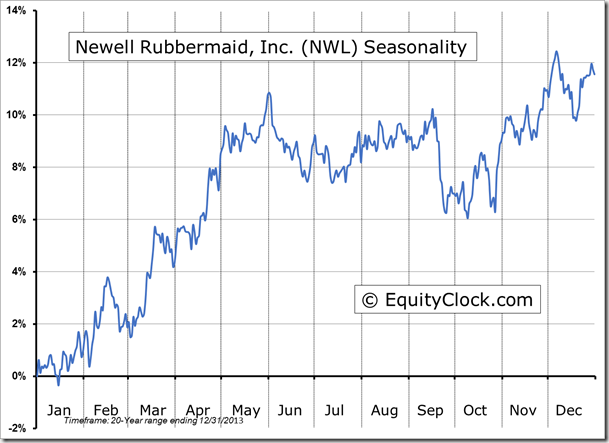
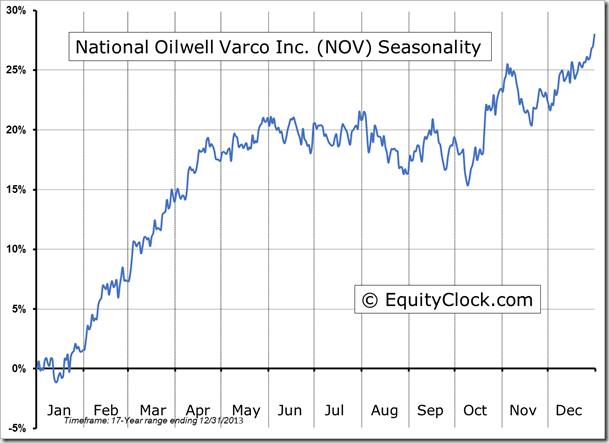
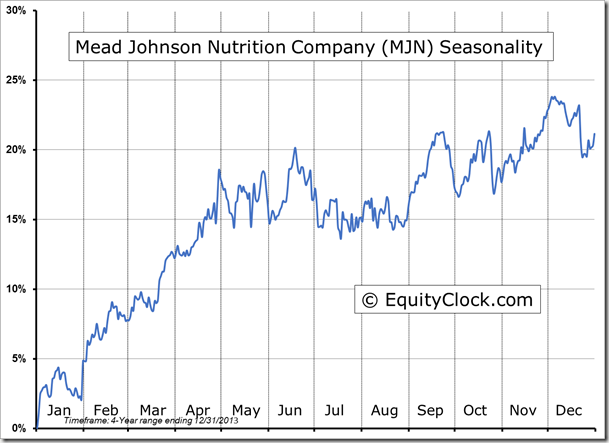
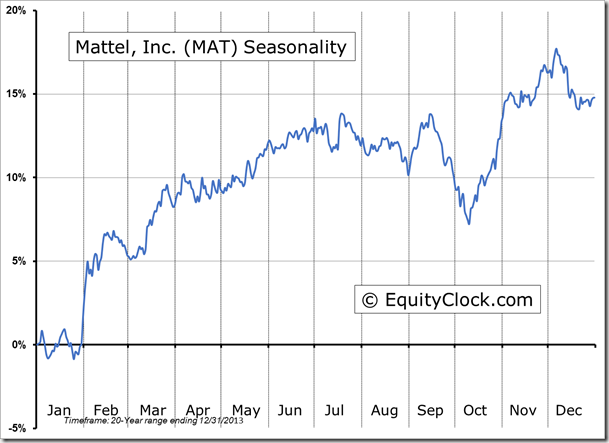
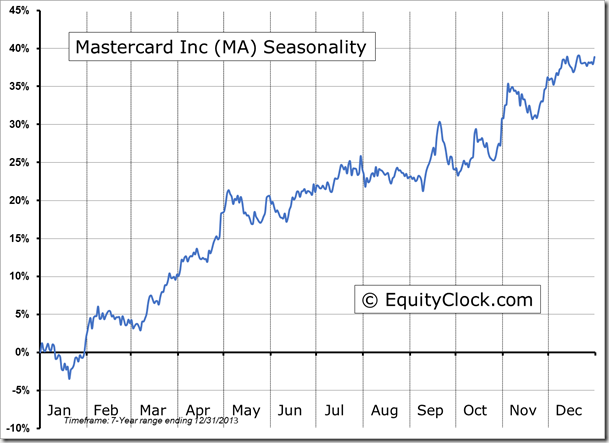
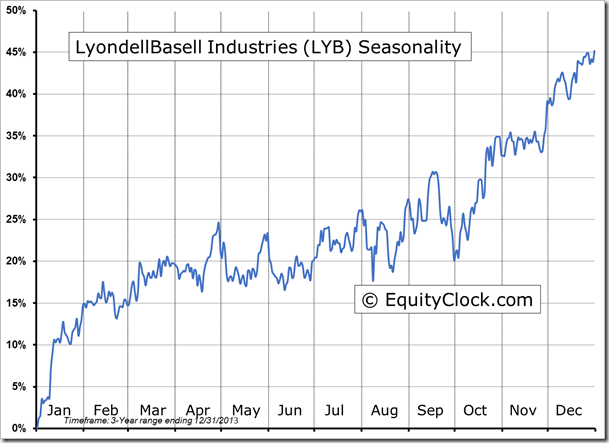
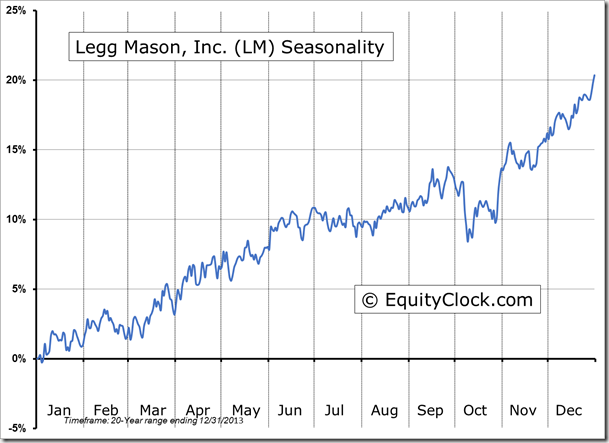
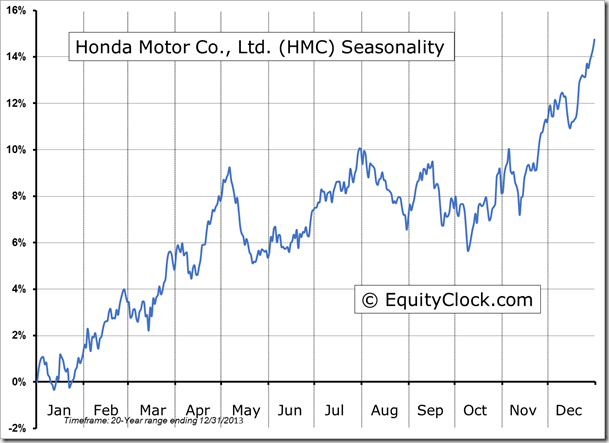
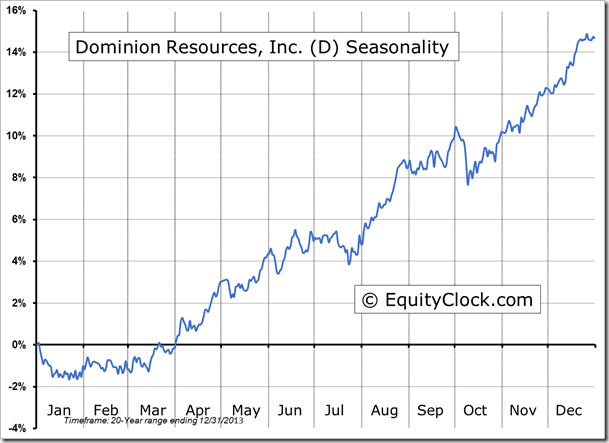
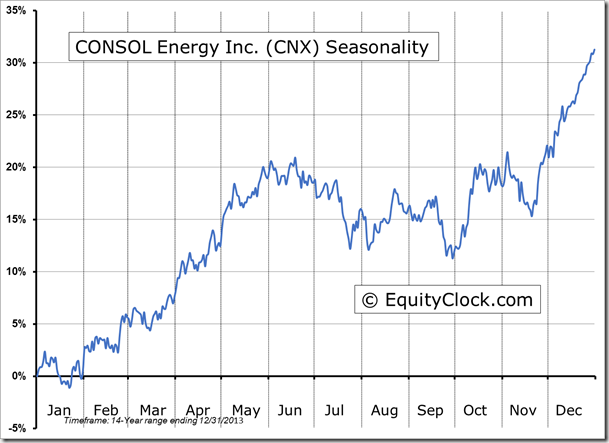
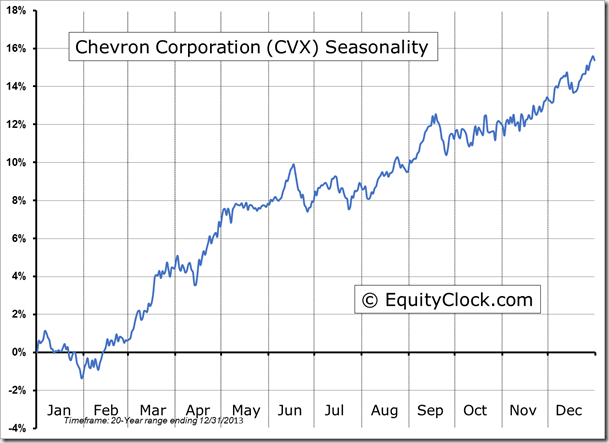
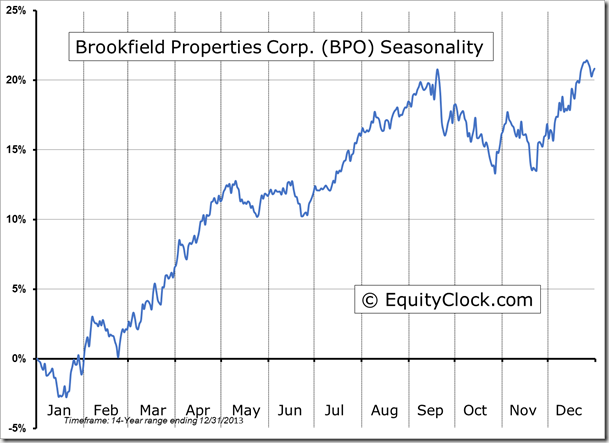
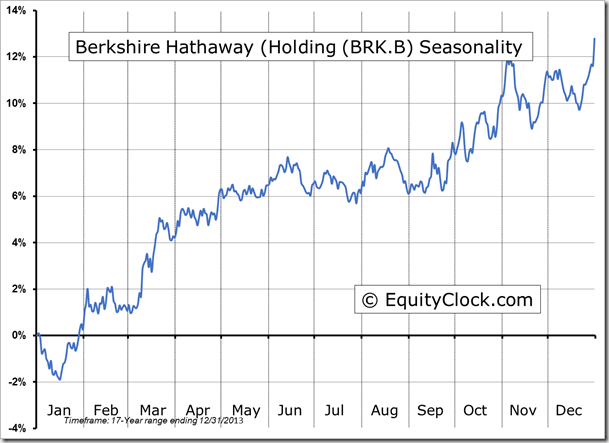
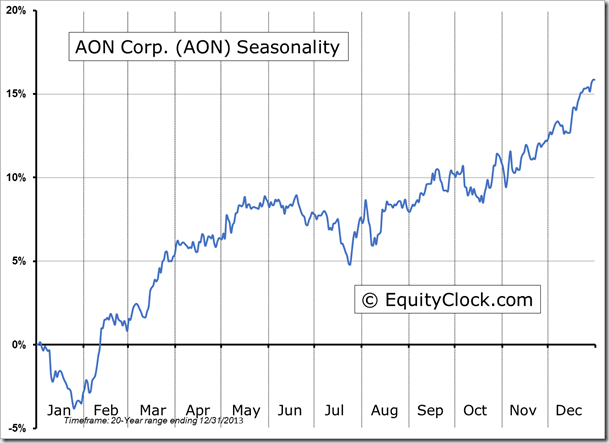
Seasonal charts of companies reporting earnings today:
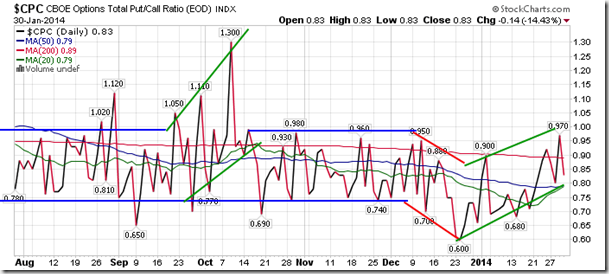
Sentiment on Thursday, as gauged by the put-call ratio, ended bullish at 0.83. The latest reading of the American Association of Individual Investors Sentiment Survey confirms the bearish trend that has become evident in the put-call ratio over recent weeks; the percent of investors who are bullish on the stock market over the next six months has declined from 55% on December 26th to 32% in yesterday’s report. Bearish sentiment currently sits at 33%, which is greater than bullish sentiment for the first time since last August when option activity also began a bearish trend that persisted through to October.
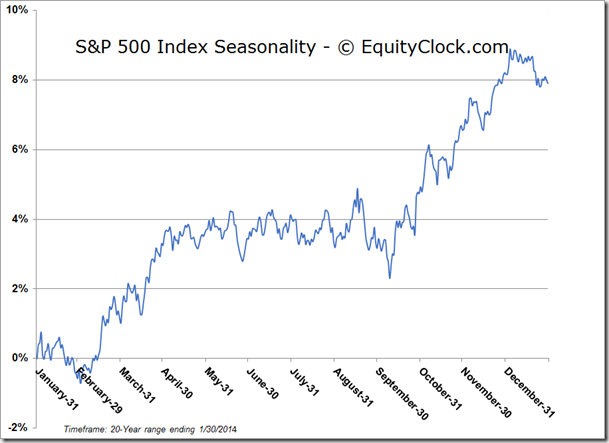
S&P 500 Index
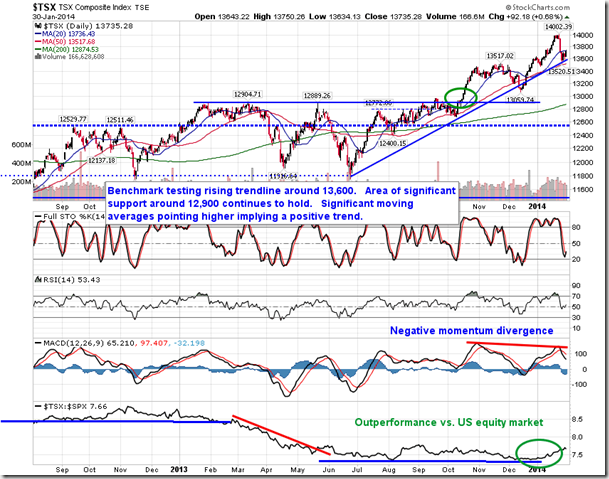
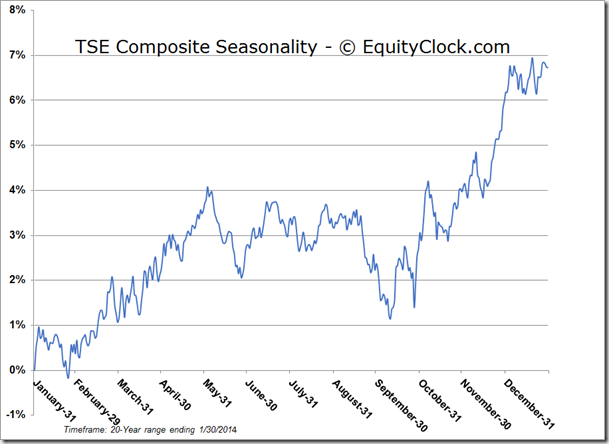
TSE Composite
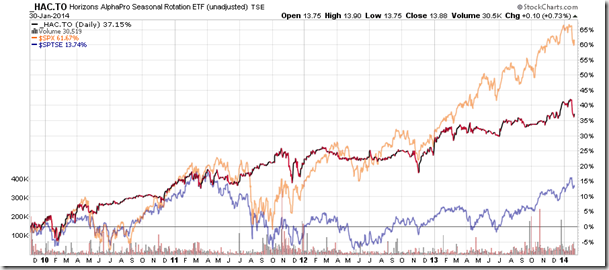
Horizons Seasonal Rotation ETF (TSX:HAC)
- Closing Market Value: $13.88 (up 0.73%)
- Closing NAV/Unit: $13.88 (up 0.72%)
Performance*
| 2014 Year-to-Date | Since Inception (Nov 19, 2009) | |
| HAC.TO | -2.94% | 38.8% |
* performance calculated on Closing NAV/Unit as provided by custodian
