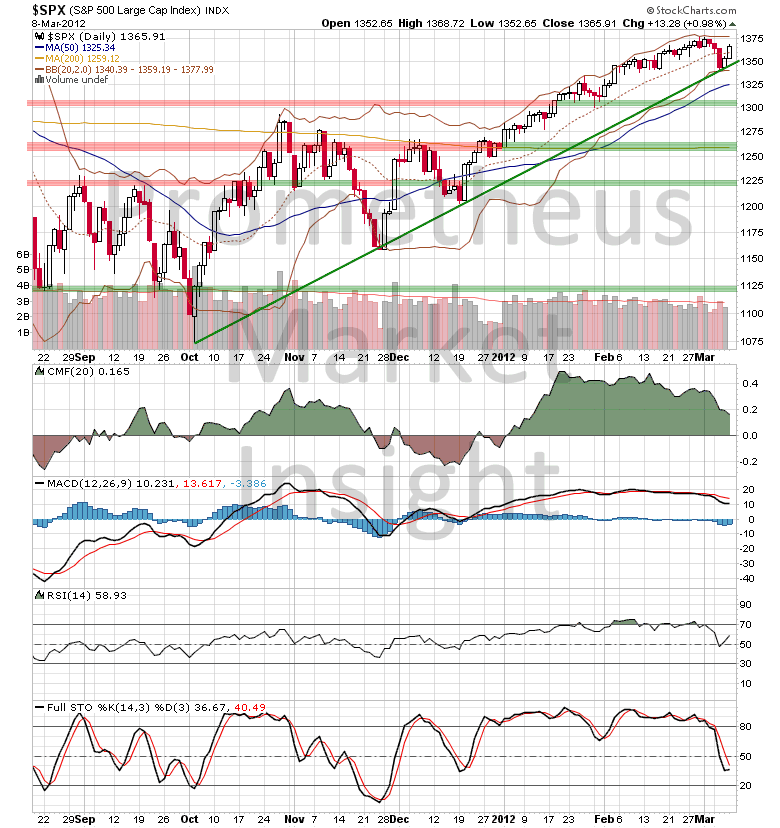
The S&P 500 index closed moderately higher today, rebounding further off of support at the lower boundary of the uptrend from October and approaching recent highs.
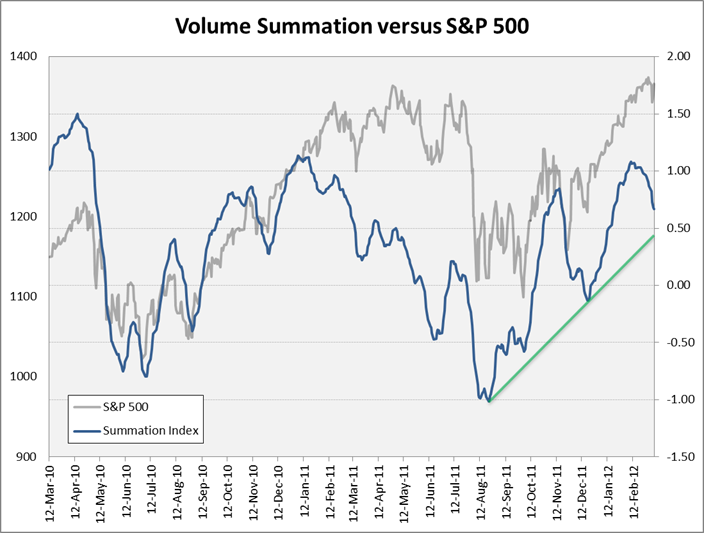
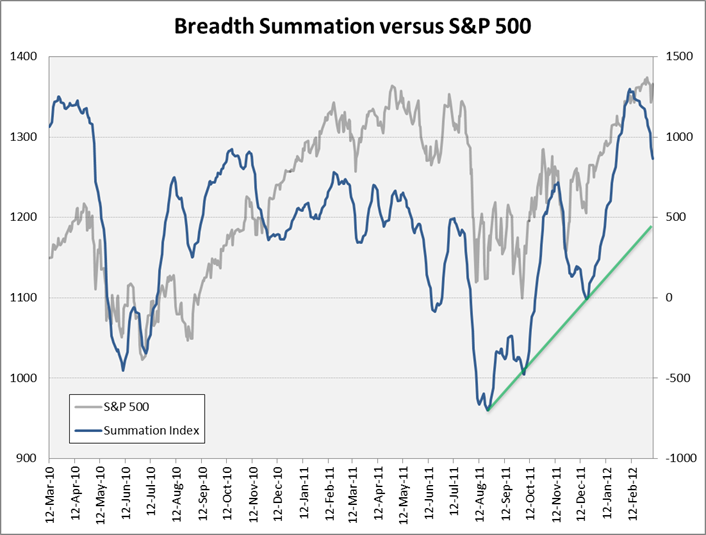
As we have noted often during the last several weeks, the rally is extremely overextended on a short-term basis and it will almost certainly be followed by a violent overbought correction. Breakdowns in price are often preceded by breakdowns in market internals such as volume and breadth. The following graphs display the long-term views of volume summation and breadth summation, both of which have been moving lower since peaking in February.

These retracements in volume and breadth are early signs of developing weakness in the rally from October. However, they do not suggest that a long-term reversal is imminent. Price will often continue to trend higher as internal indicators move lower, especially when a rally becomes highly speculative and market sentiment approaches bullish extremes. For example, notice how both indicators trended lower during the development of the topping formation in 2011. A long-term top is a process, not an event, and these downturns in volume and breadth suggest that the rally is losing internal strength. Market behavior during the next several weeks will provide the next signal with respect to long-term direction, so it will be important to monitor price and internals closely. We will identify the key developments as they occur in our daily market forecasts and signal notifications available to subscribers.
- English (UK)
- English (India)
- English (Canada)
- English (Australia)
- English (South Africa)
- English (Philippines)
- English (Nigeria)
- Deutsch
- Español (España)
- Español (México)
- Français
- Italiano
- Nederlands
- Português (Portugal)
- Polski
- Português (Brasil)
- Русский
- Türkçe
- العربية
- Ελληνικά
- Svenska
- Suomi
- עברית
- 日本語
- 한국어
- 简体中文
- 繁體中文
- Bahasa Indonesia
- Bahasa Melayu
- ไทย
- Tiếng Việt
- हिंदी
Stock Market Internals Begin to Weaken
Published 03/09/2012, 12:17 AM
Updated 07/09/2023, 06:31 AM
Stock Market Internals Begin to Weaken
Latest comments
Loading next article…
Install Our App
Risk Disclosure: Trading in financial instruments and/or cryptocurrencies involves high risks including the risk of losing some, or all, of your investment amount, and may not be suitable for all investors. Prices of cryptocurrencies are extremely volatile and may be affected by external factors such as financial, regulatory or political events. Trading on margin increases the financial risks.
Before deciding to trade in financial instrument or cryptocurrencies you should be fully informed of the risks and costs associated with trading the financial markets, carefully consider your investment objectives, level of experience, and risk appetite, and seek professional advice where needed.
Fusion Media would like to remind you that the data contained in this website is not necessarily real-time nor accurate. The data and prices on the website are not necessarily provided by any market or exchange, but may be provided by market makers, and so prices may not be accurate and may differ from the actual price at any given market, meaning prices are indicative and not appropriate for trading purposes. Fusion Media and any provider of the data contained in this website will not accept liability for any loss or damage as a result of your trading, or your reliance on the information contained within this website.
It is prohibited to use, store, reproduce, display, modify, transmit or distribute the data contained in this website without the explicit prior written permission of Fusion Media and/or the data provider. All intellectual property rights are reserved by the providers and/or the exchange providing the data contained in this website.
Fusion Media may be compensated by the advertisers that appear on the website, based on your interaction with the advertisements or advertisers.
© 2007-2024 - Fusion Media Limited. All Rights Reserved.
