Stock Indices Weekly Technical Strategy Outlook (Jun 8 - Jun 12)
S&P 500 E-mini Futures: Relentless Up Move Resumes
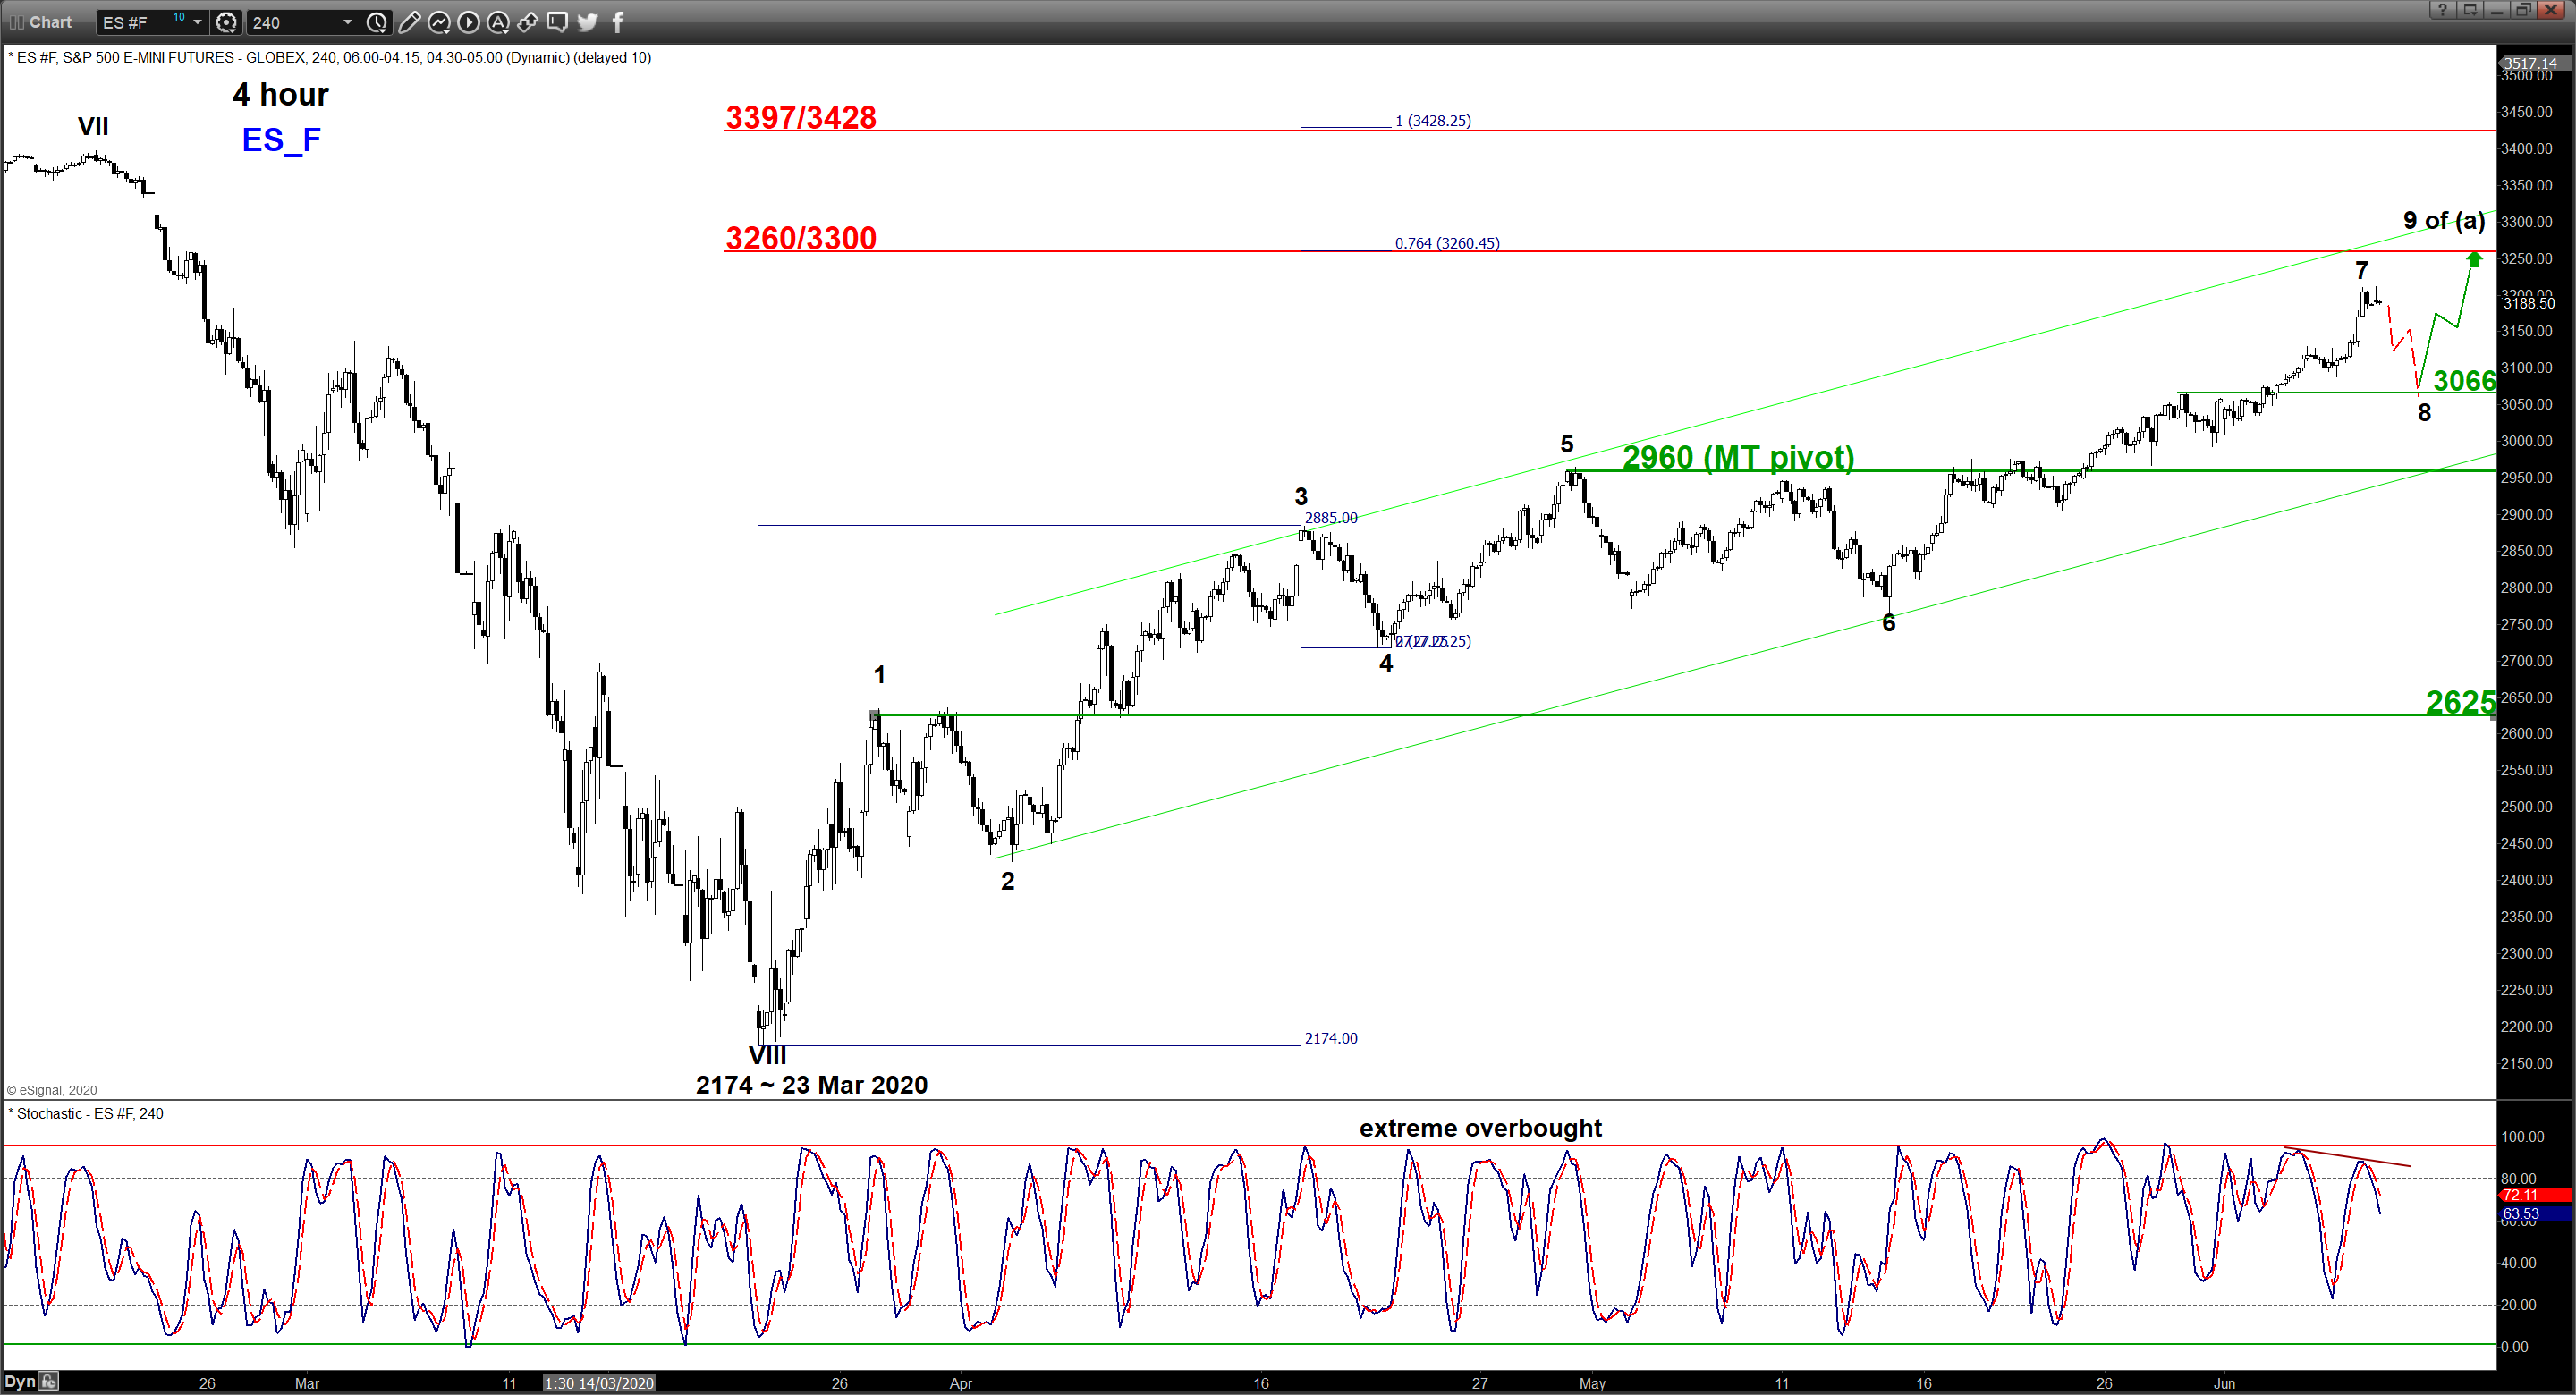
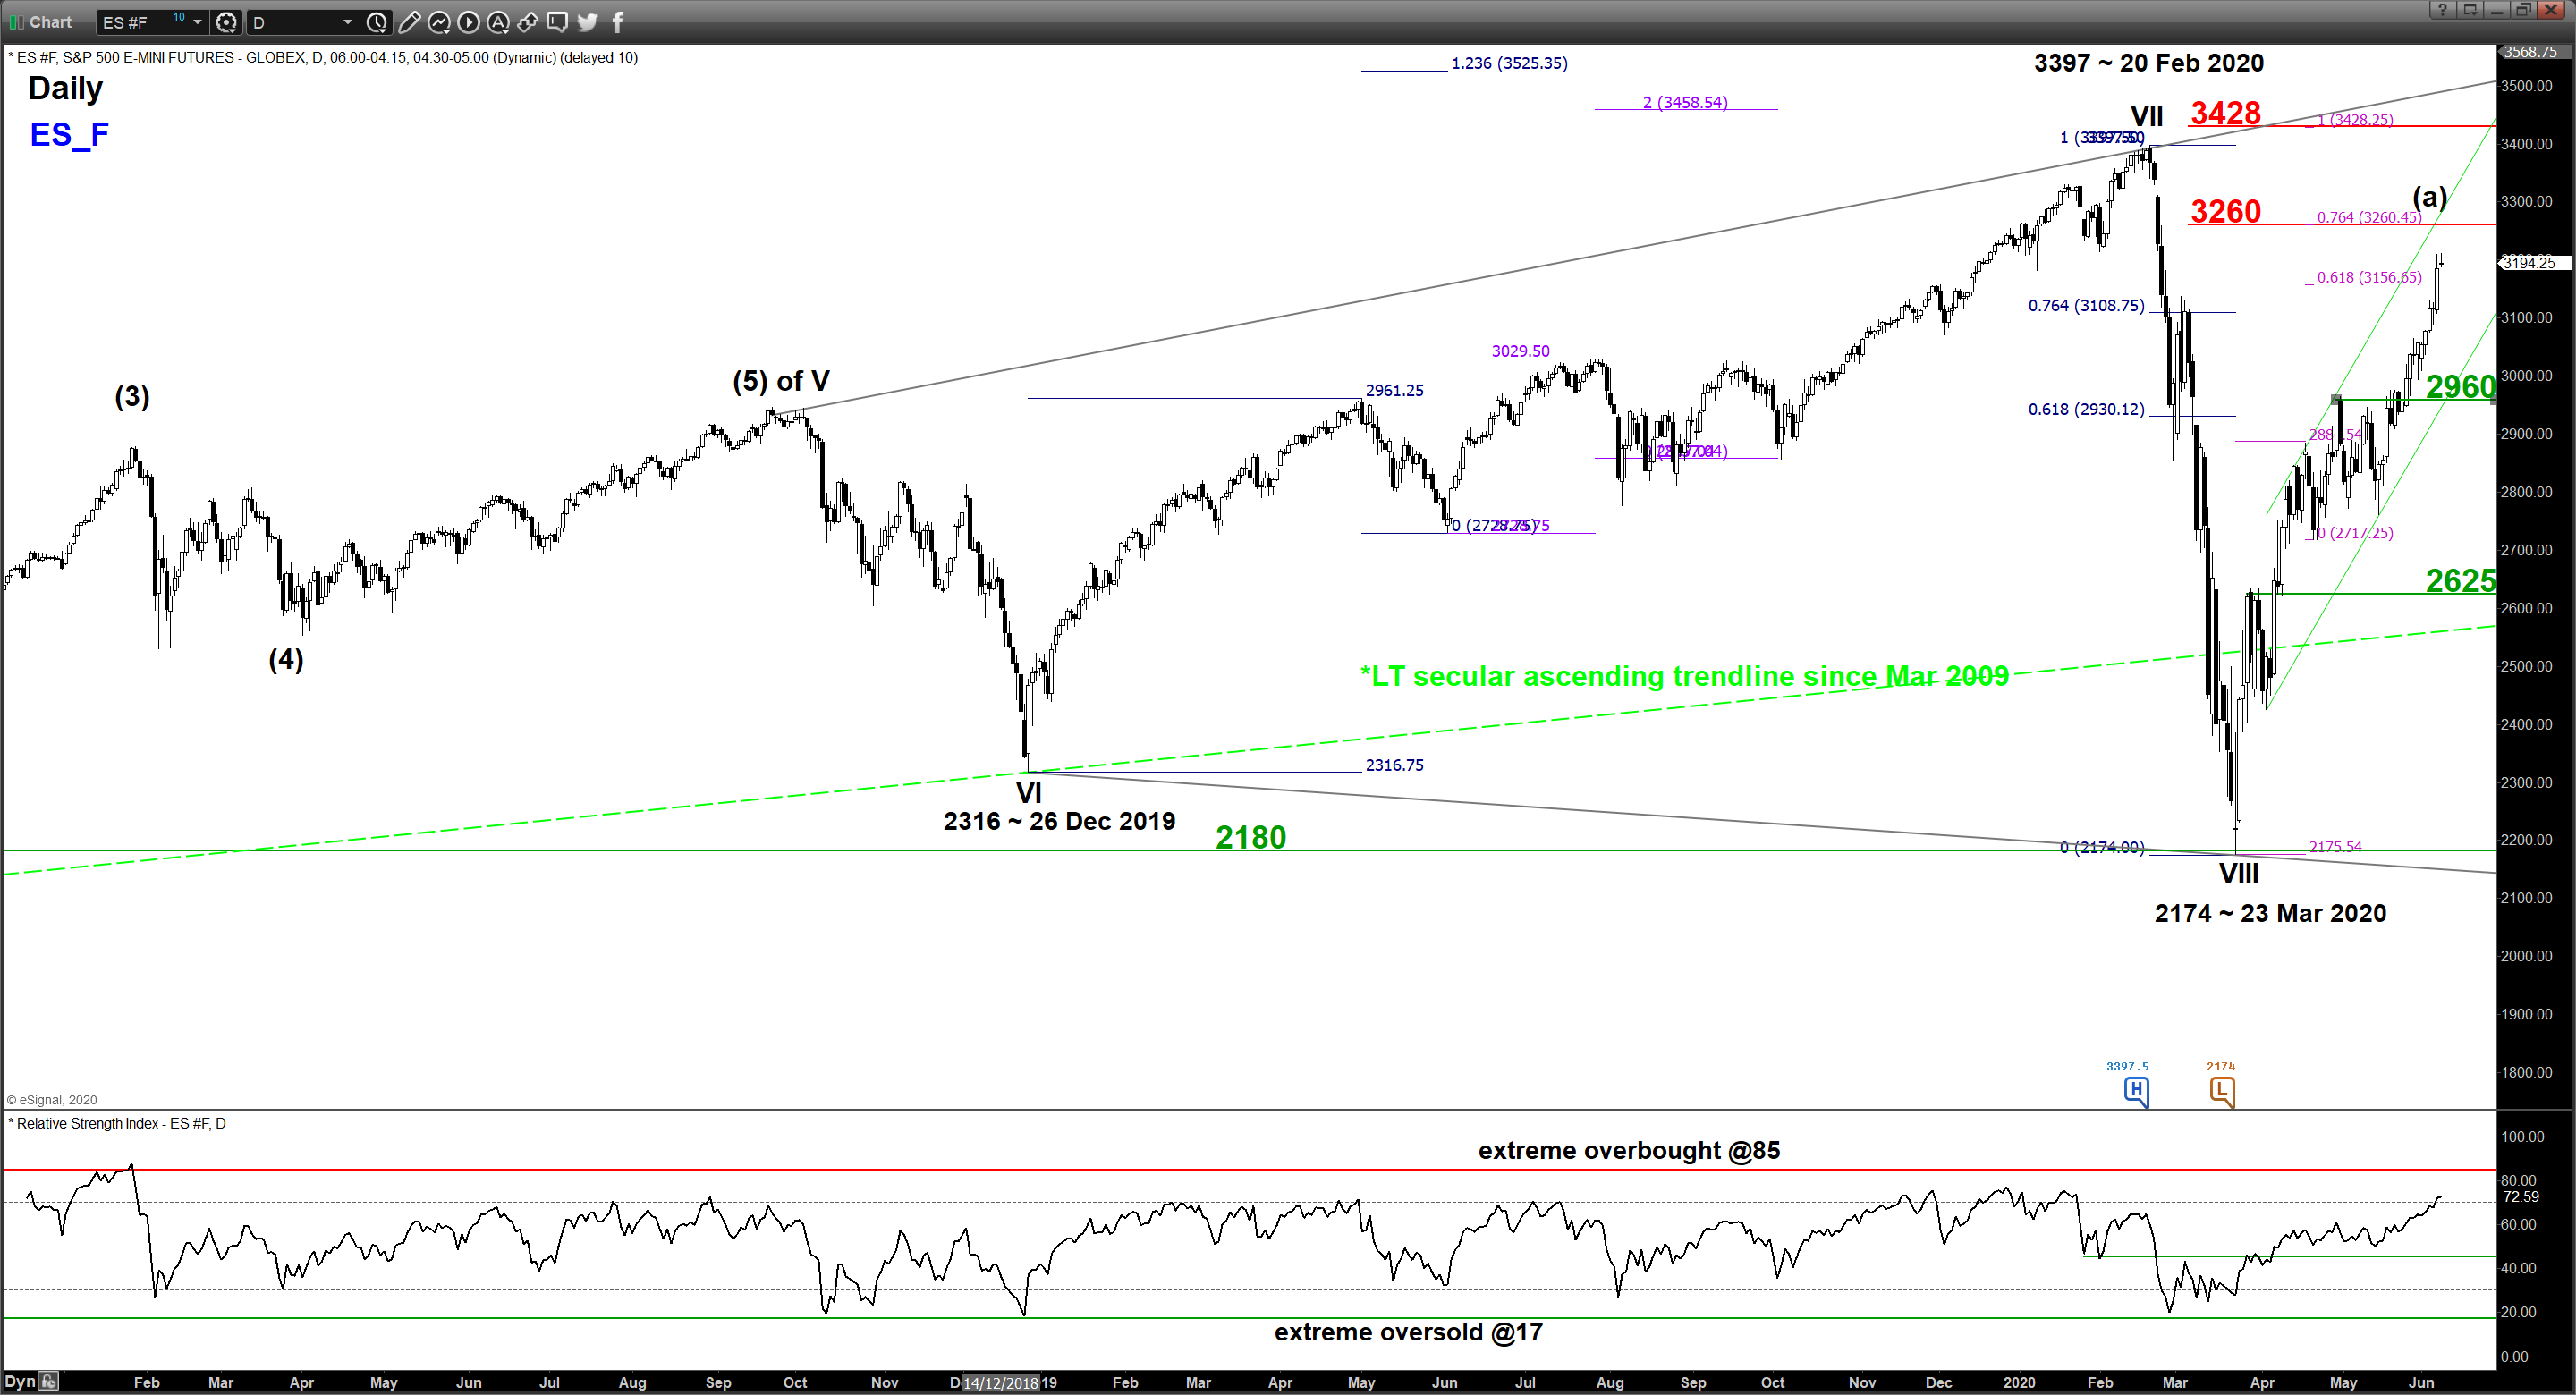
Key levels
- Immediate support: 3066
- Pivot (key support): 2960
- Resistances: 3260/3300 & 3397/3428
- Next support: 2625
Directional Bias
Bullish bias for the S&P 500 E-mini futures but risk of a potential minor pull-back first towards 3066 with a maximum limit set at 2960 key medium-term pivotal support before new upleg materializes to target 3260/3300 next.
On the other hand, a daily close below 2960 invalidates the bullish scenario to kickstart the multi-week corrective decline towards the next support at 2625.
Key Elements
- The Index is still evolving in an intermediate term Elliot Wave bullish impulsive sequence (likely 8 & 9 of (a)) in place since 23 Mar low of 2174.
- Price action of the Index is also evolving within an ascending channel in place since 02 Apr 2020 low of 2424 with the upper boundary/resistance of 3260/3300 that confluences with a key Fibonacci extension level.
- The 4-hour Stochastic oscillator has flashed a bearish divergence signal at an extreme overbought level which suggests that the recent short-term upside momentum has started to ease wane. These observations support the risk of a minor pull-back in price action below 3211 within the aforementioned bullish impulsive wave sequence.
NASDAQ 100 E-mini Futures: Fresh All-Time High Without Exhaustion Signals
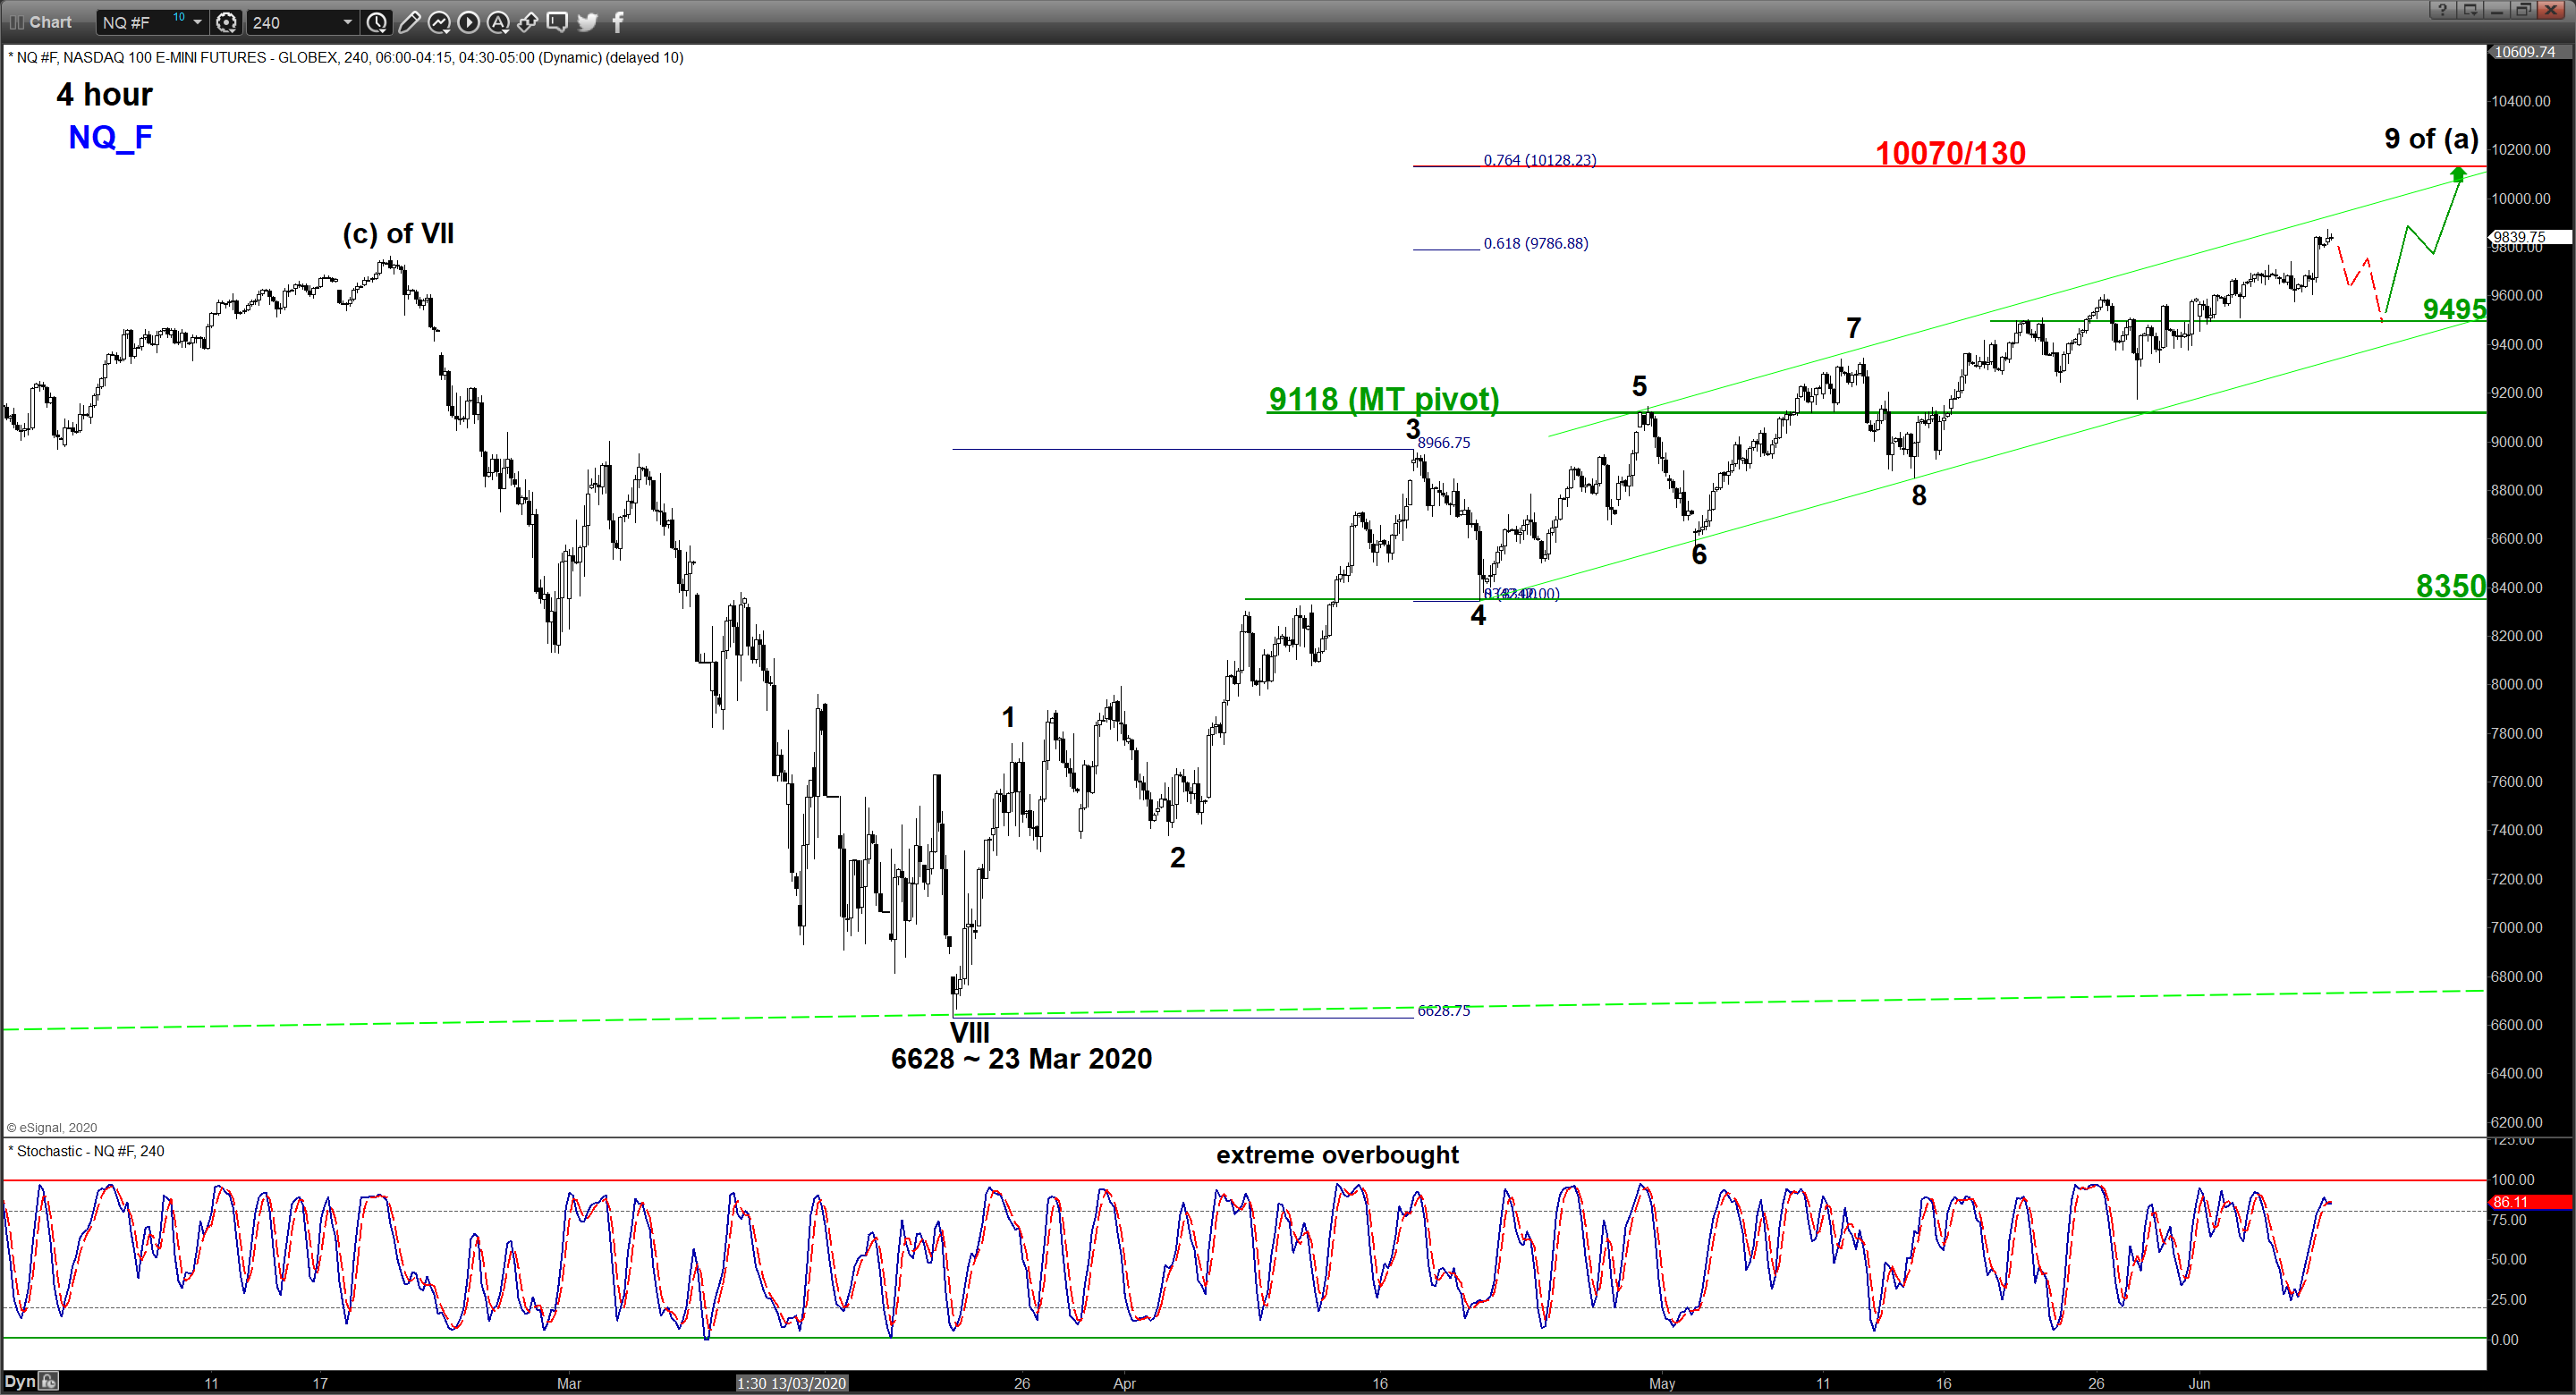
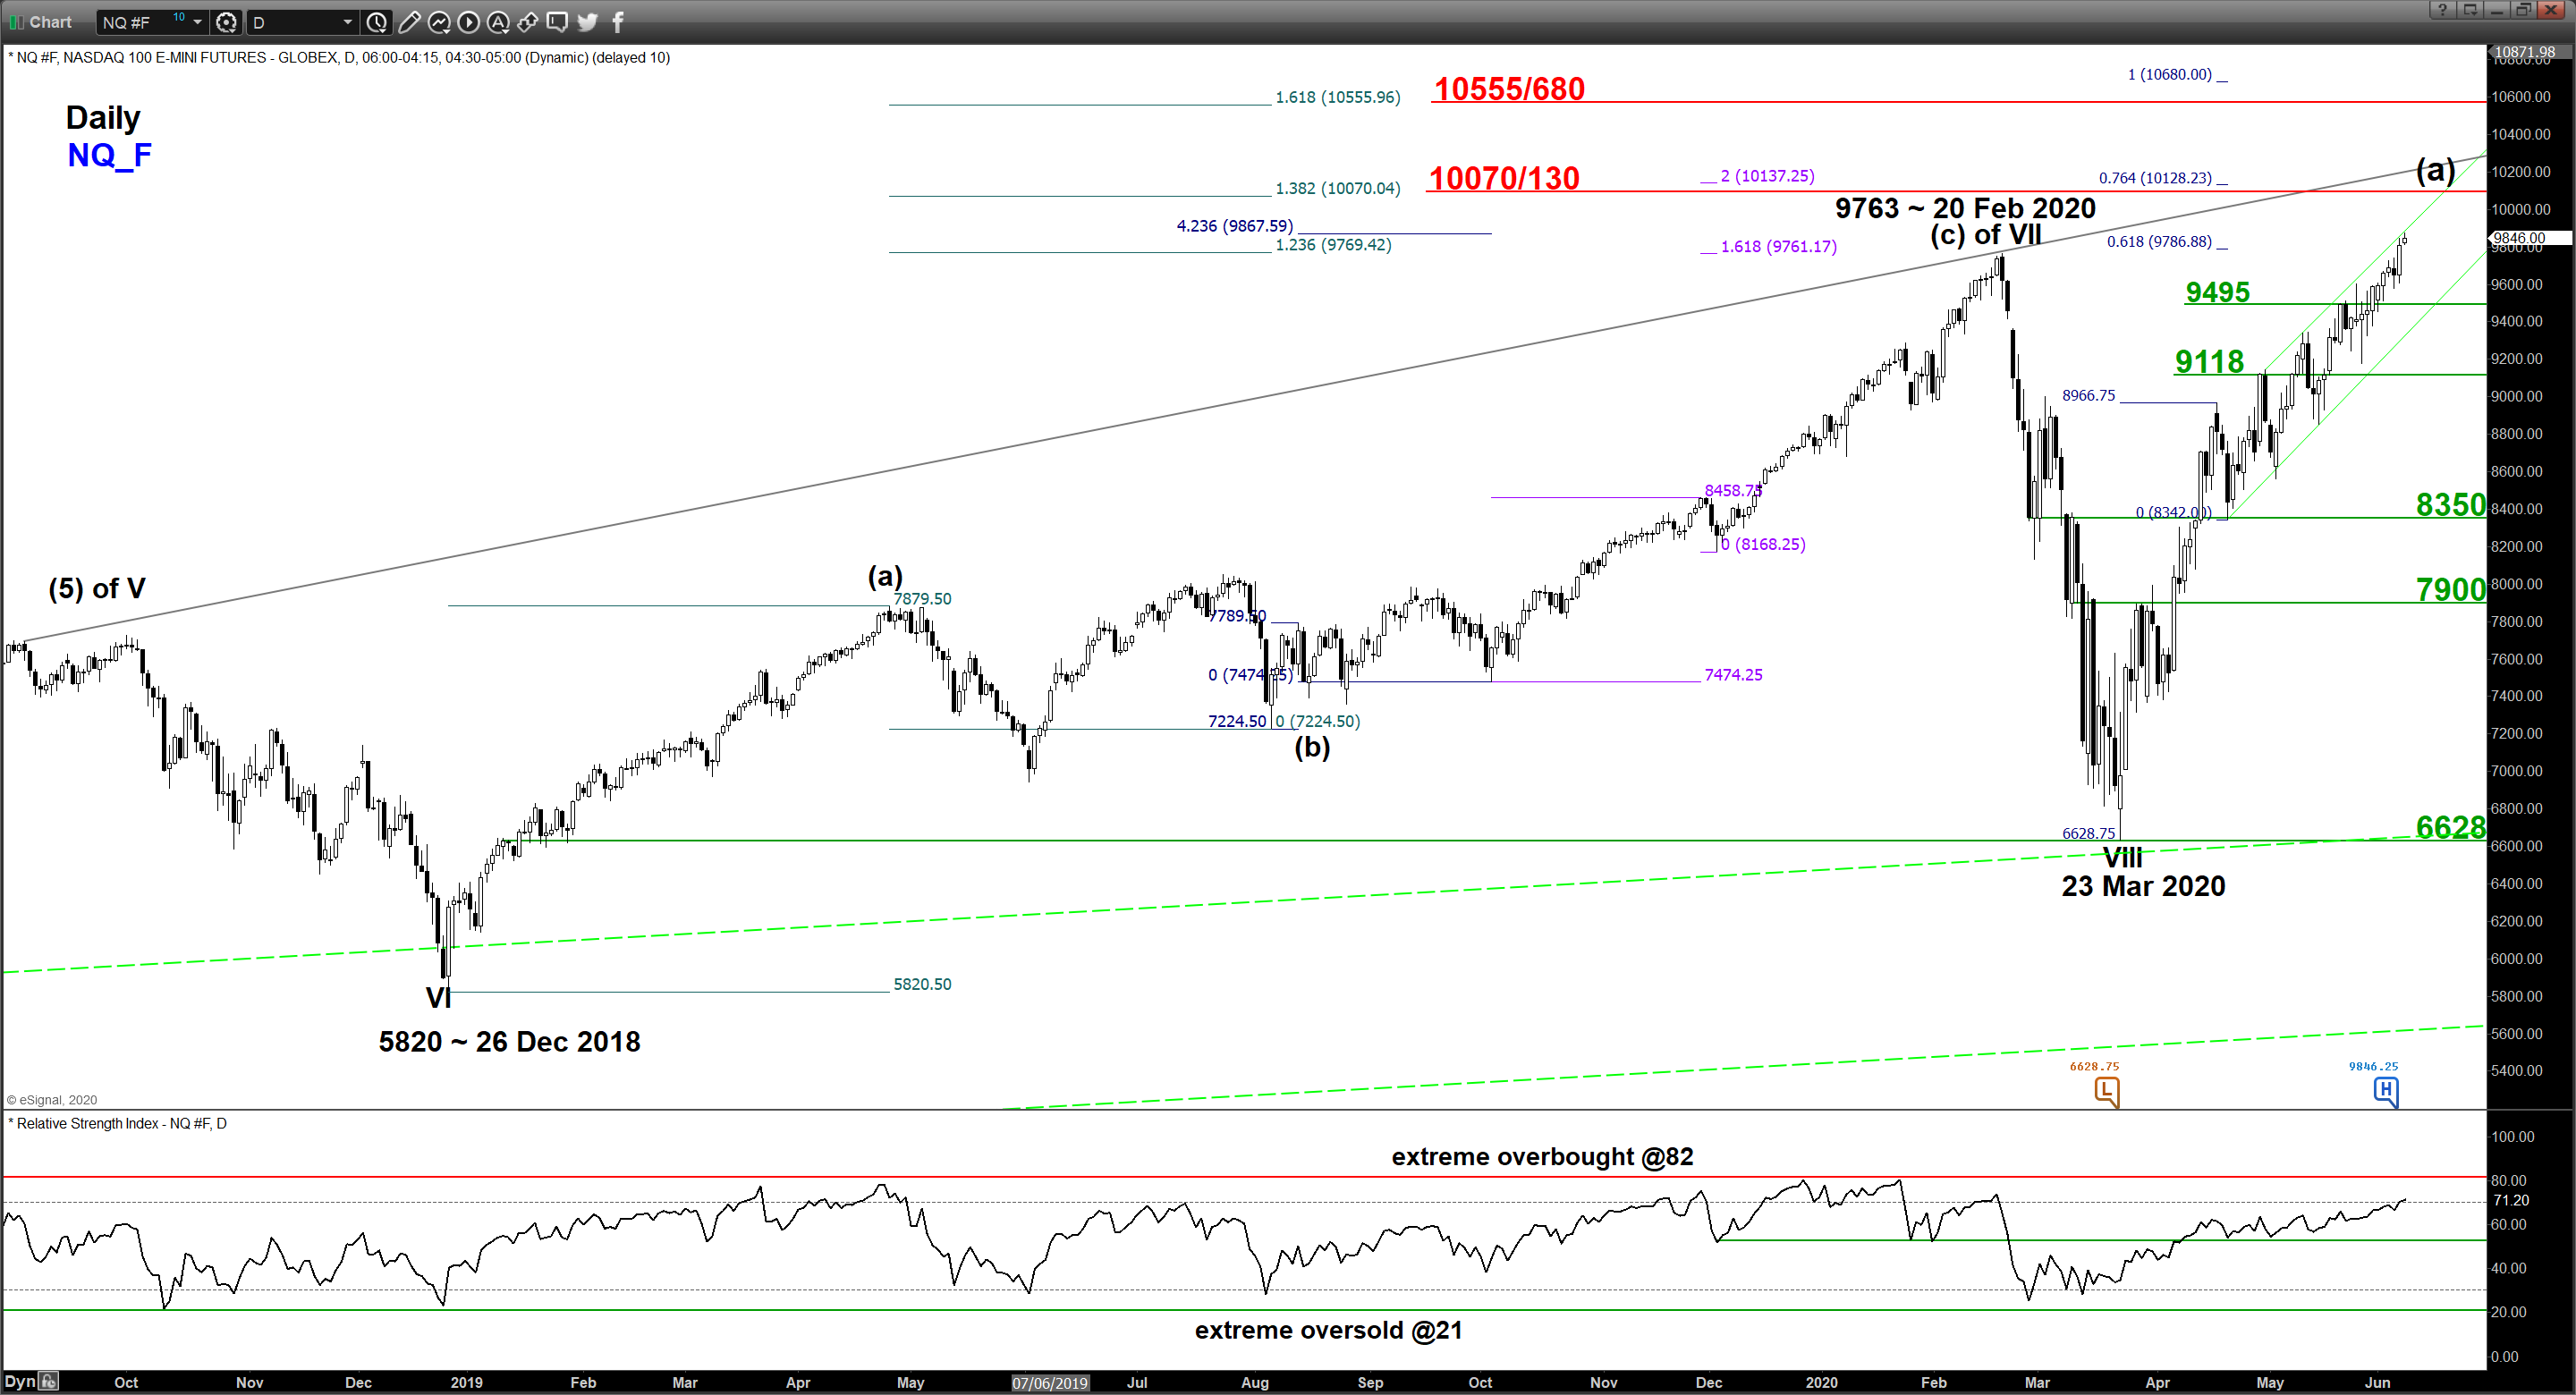
Key Levels
- Immediate support: 9495
- Pivot (key support): 9118
- Resistances: 10070/130 & 10555/680
- Next support: 8350
Directional Bias
Bullish bias for the NASDAQ 100 E-mini futures but risk of a potential minor pull-back first towards 9495 with a maximum limit set at 9118 key medium-term pivotal support before new upleg materializes to target 10070/130 next.
On the other hand, a daily close below 9118 invalidates the bullish scenario to kickstart the multi-week corrective decline towards the next support at 8350.
Key Elements
- The daily RSI oscillator is still not showing any sign of momentum exhaustion and has further room to maneuver to the upside before it reaches an extreme overbought level of 82. These observations suggest that medium-term upside momentum remains intact to support a further potential up move in price action of the Index
- The Index is still evolving in an intermediate-term Elliot Wave bullish impulsive sequence (likely 9 of (a)) in place since 23 Mar low of 2174.
- The current price action of the Index has reached a high of 9875 in today, 06 Jun Asia session which coincides with the upper boundary/resistance of a medium-term ascending channel in place since 21 Apr 2020 low of 8342. Also, the 4-hour Stochastic oscillator has almost reached an extreme overbought level.
- Hence, the risk of a minor pull-back to occur first below 9875 within an on-going bullish impulsive sequence.
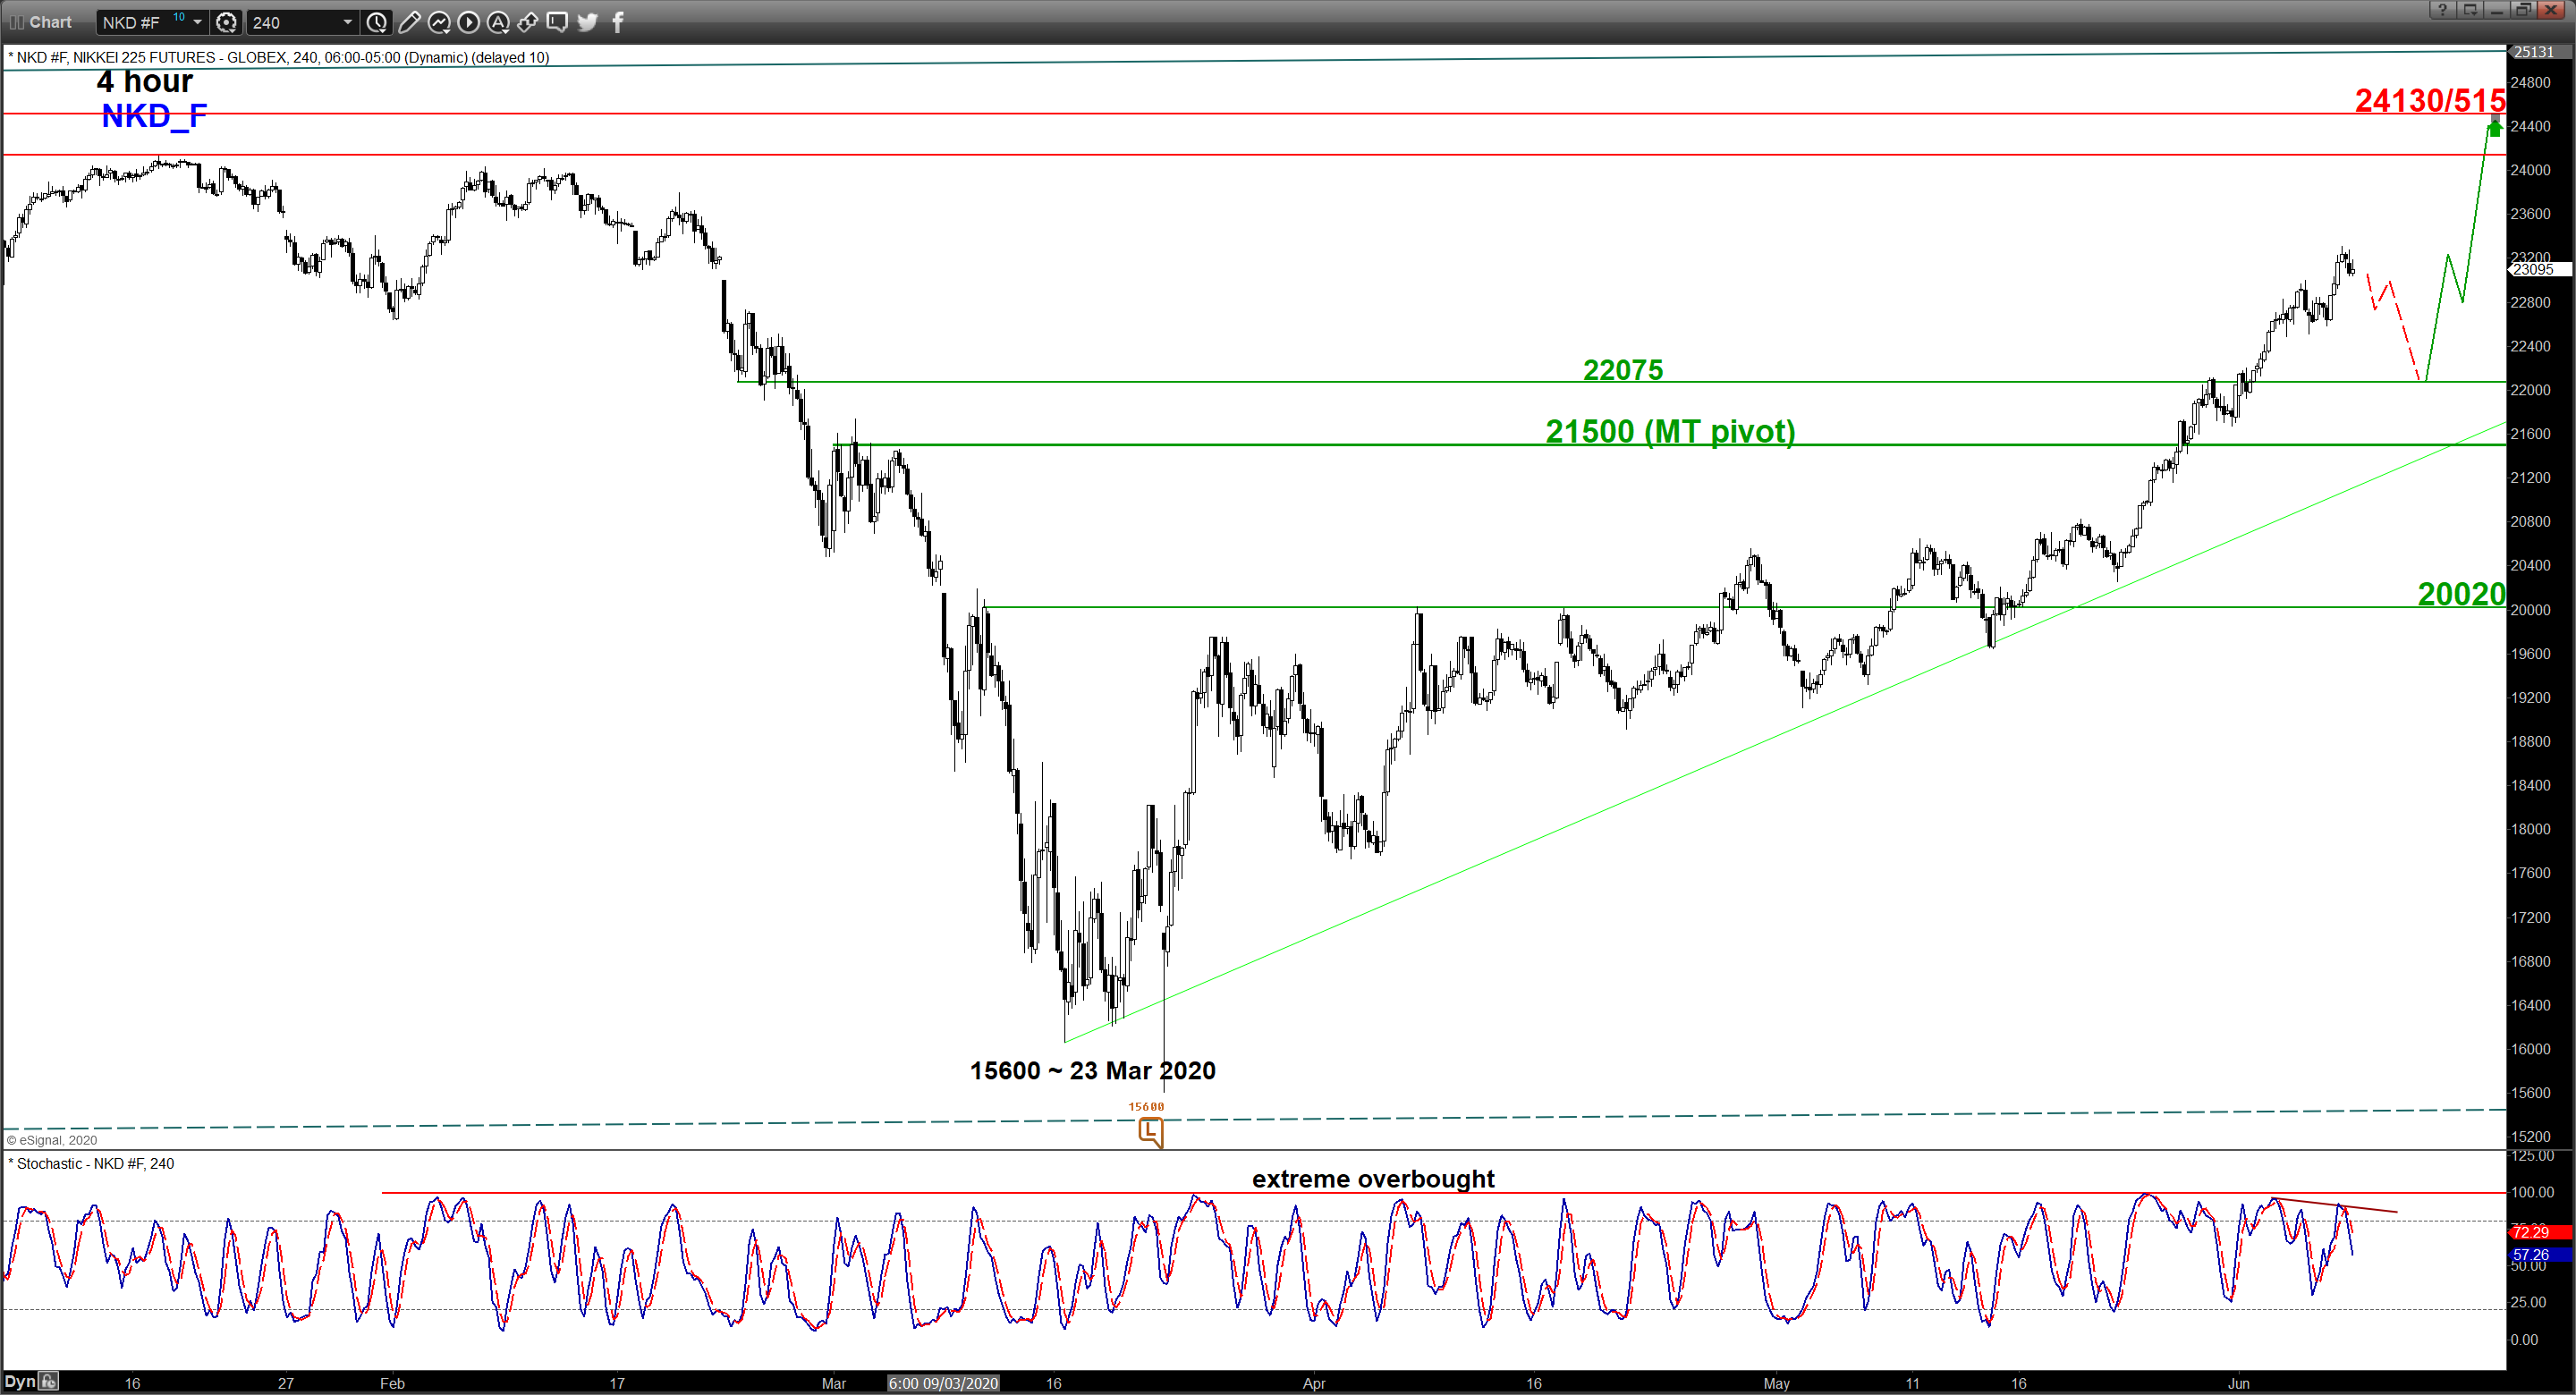
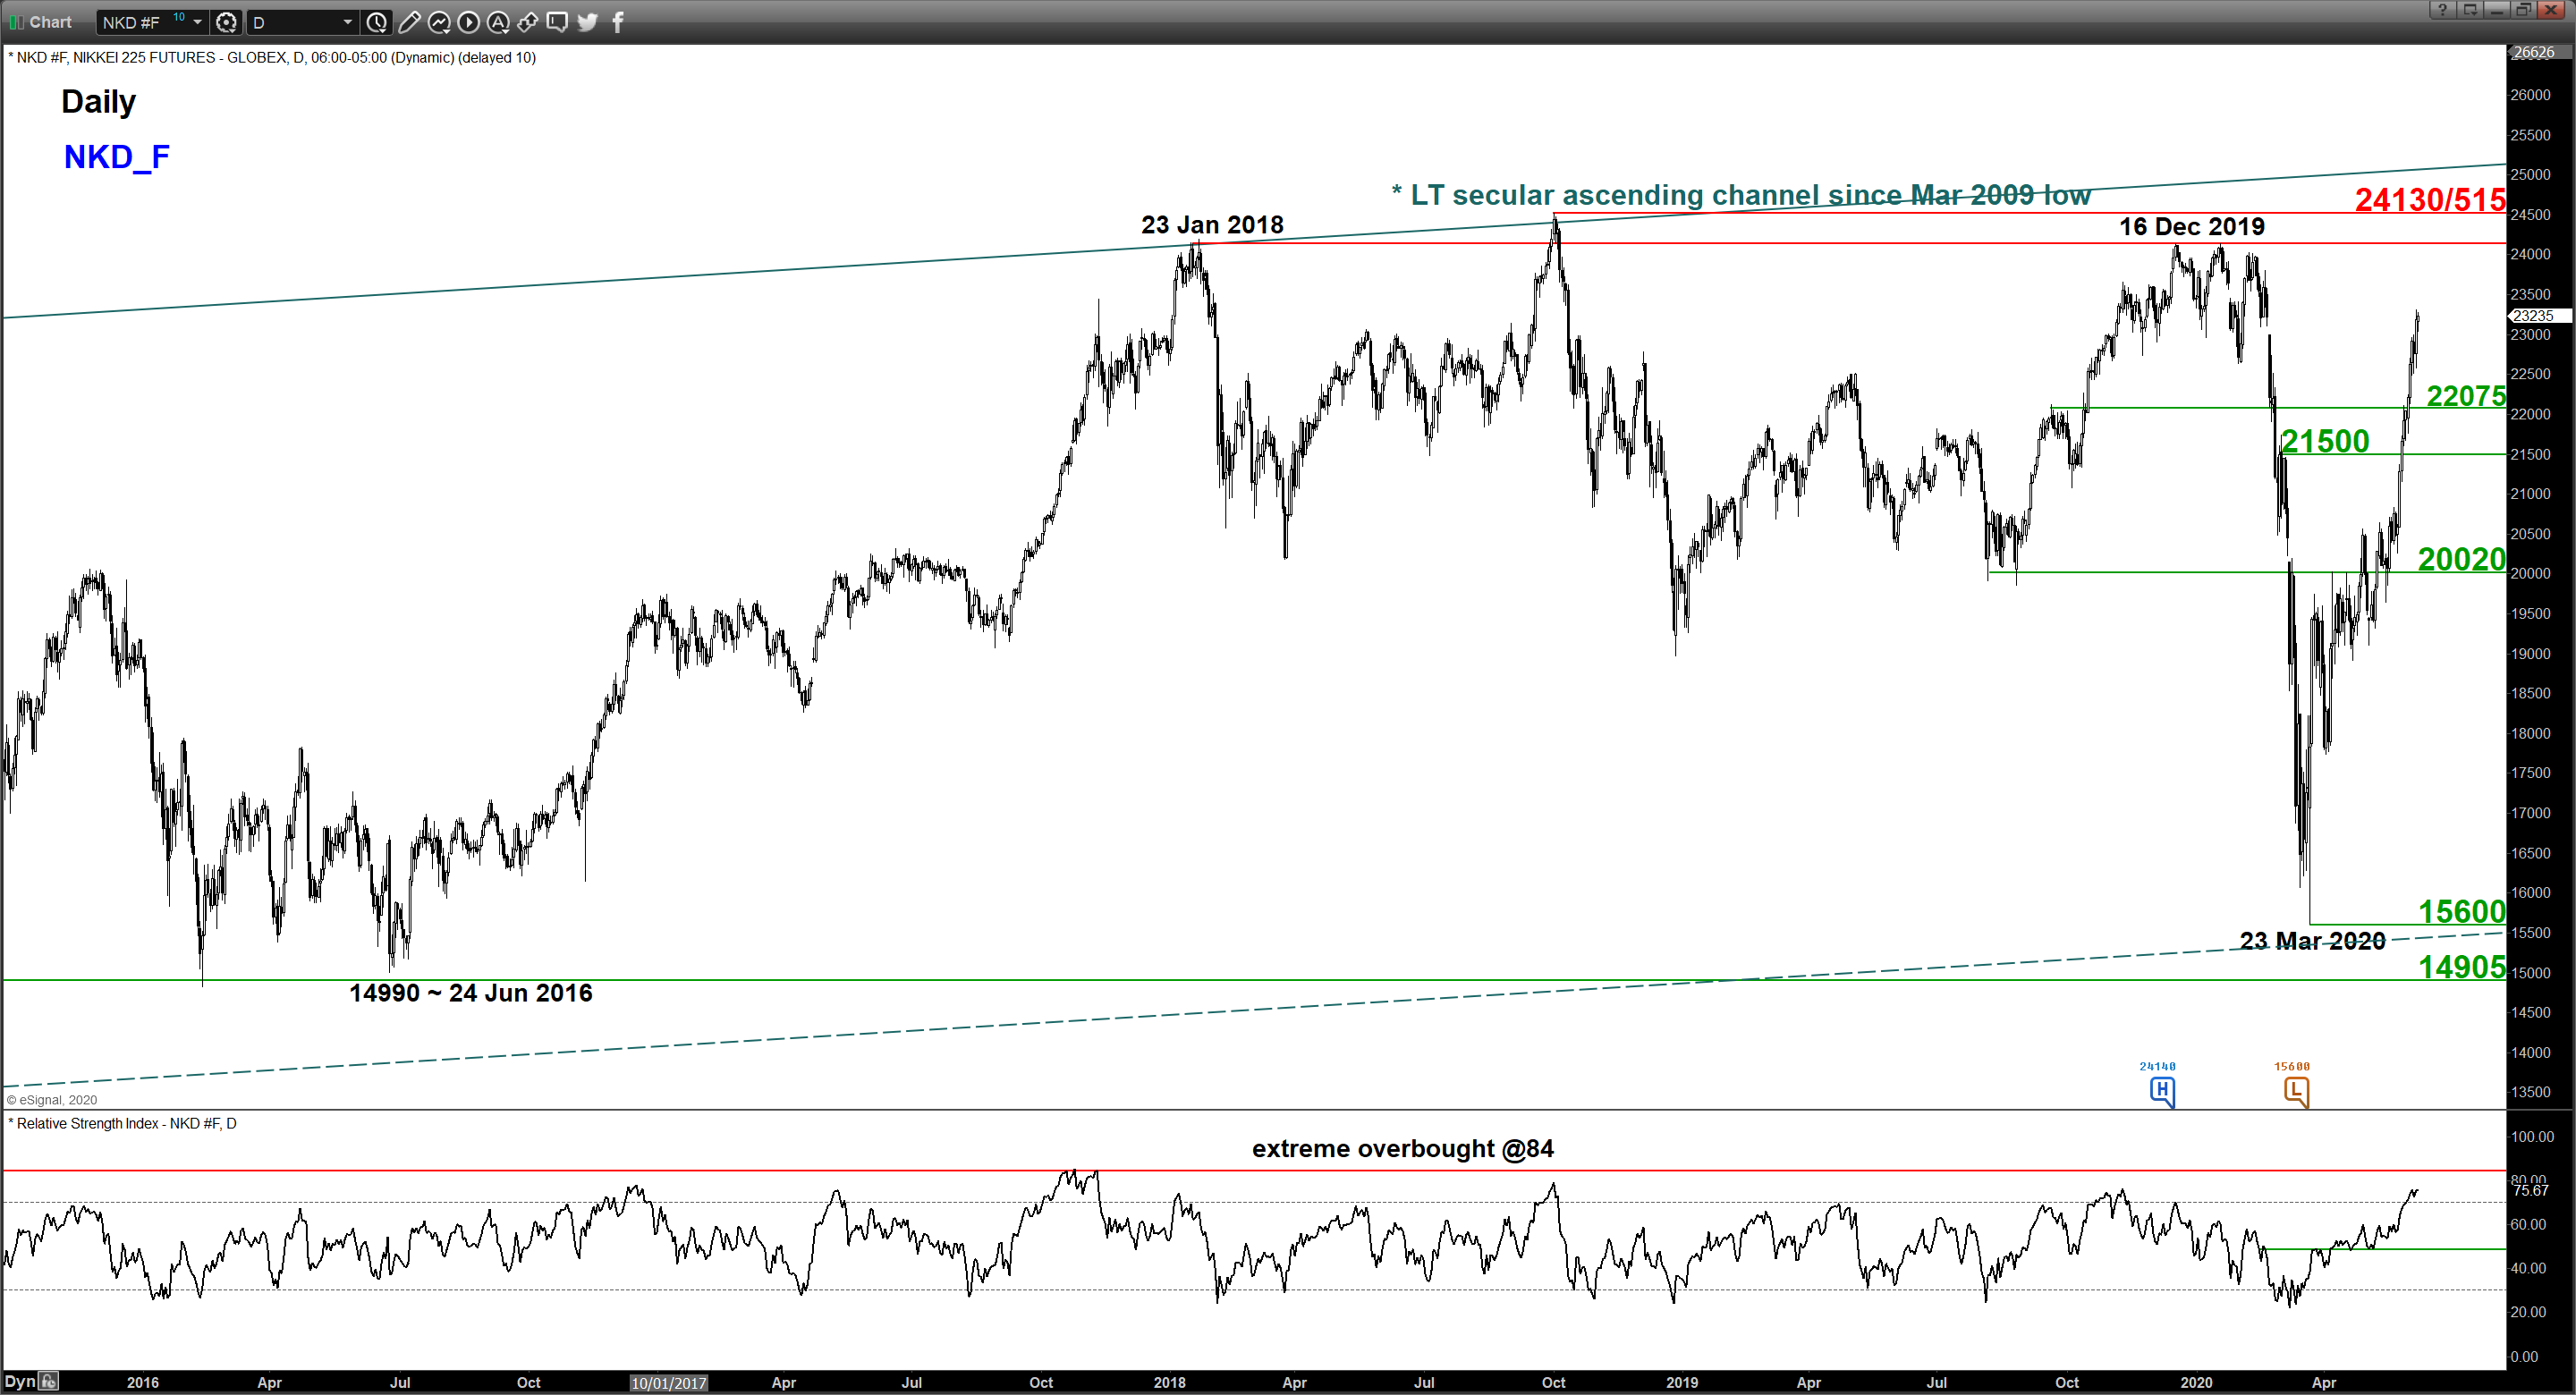
Nikkei 225 Futures: Eyeing Major Range Top Next In Place Since Jan 2018
Key Levels
- Immediate support: 22075
- Pivot (key support): 21500
- Resistance: 24130/515
- Next support: 20020
Directional Bias
Bullish bias for the Nikkei 225 futures but risk of a potential minor pull-back first towards 22075 with a maximum limit set at 21500 key medium-term pivotal support before new upleg materializes to target 24130/515.
On the other hand, a daily close below 21500 invalidates the bullish scenario to kickstart the multi-week corrective decline towards the next support at 20020.
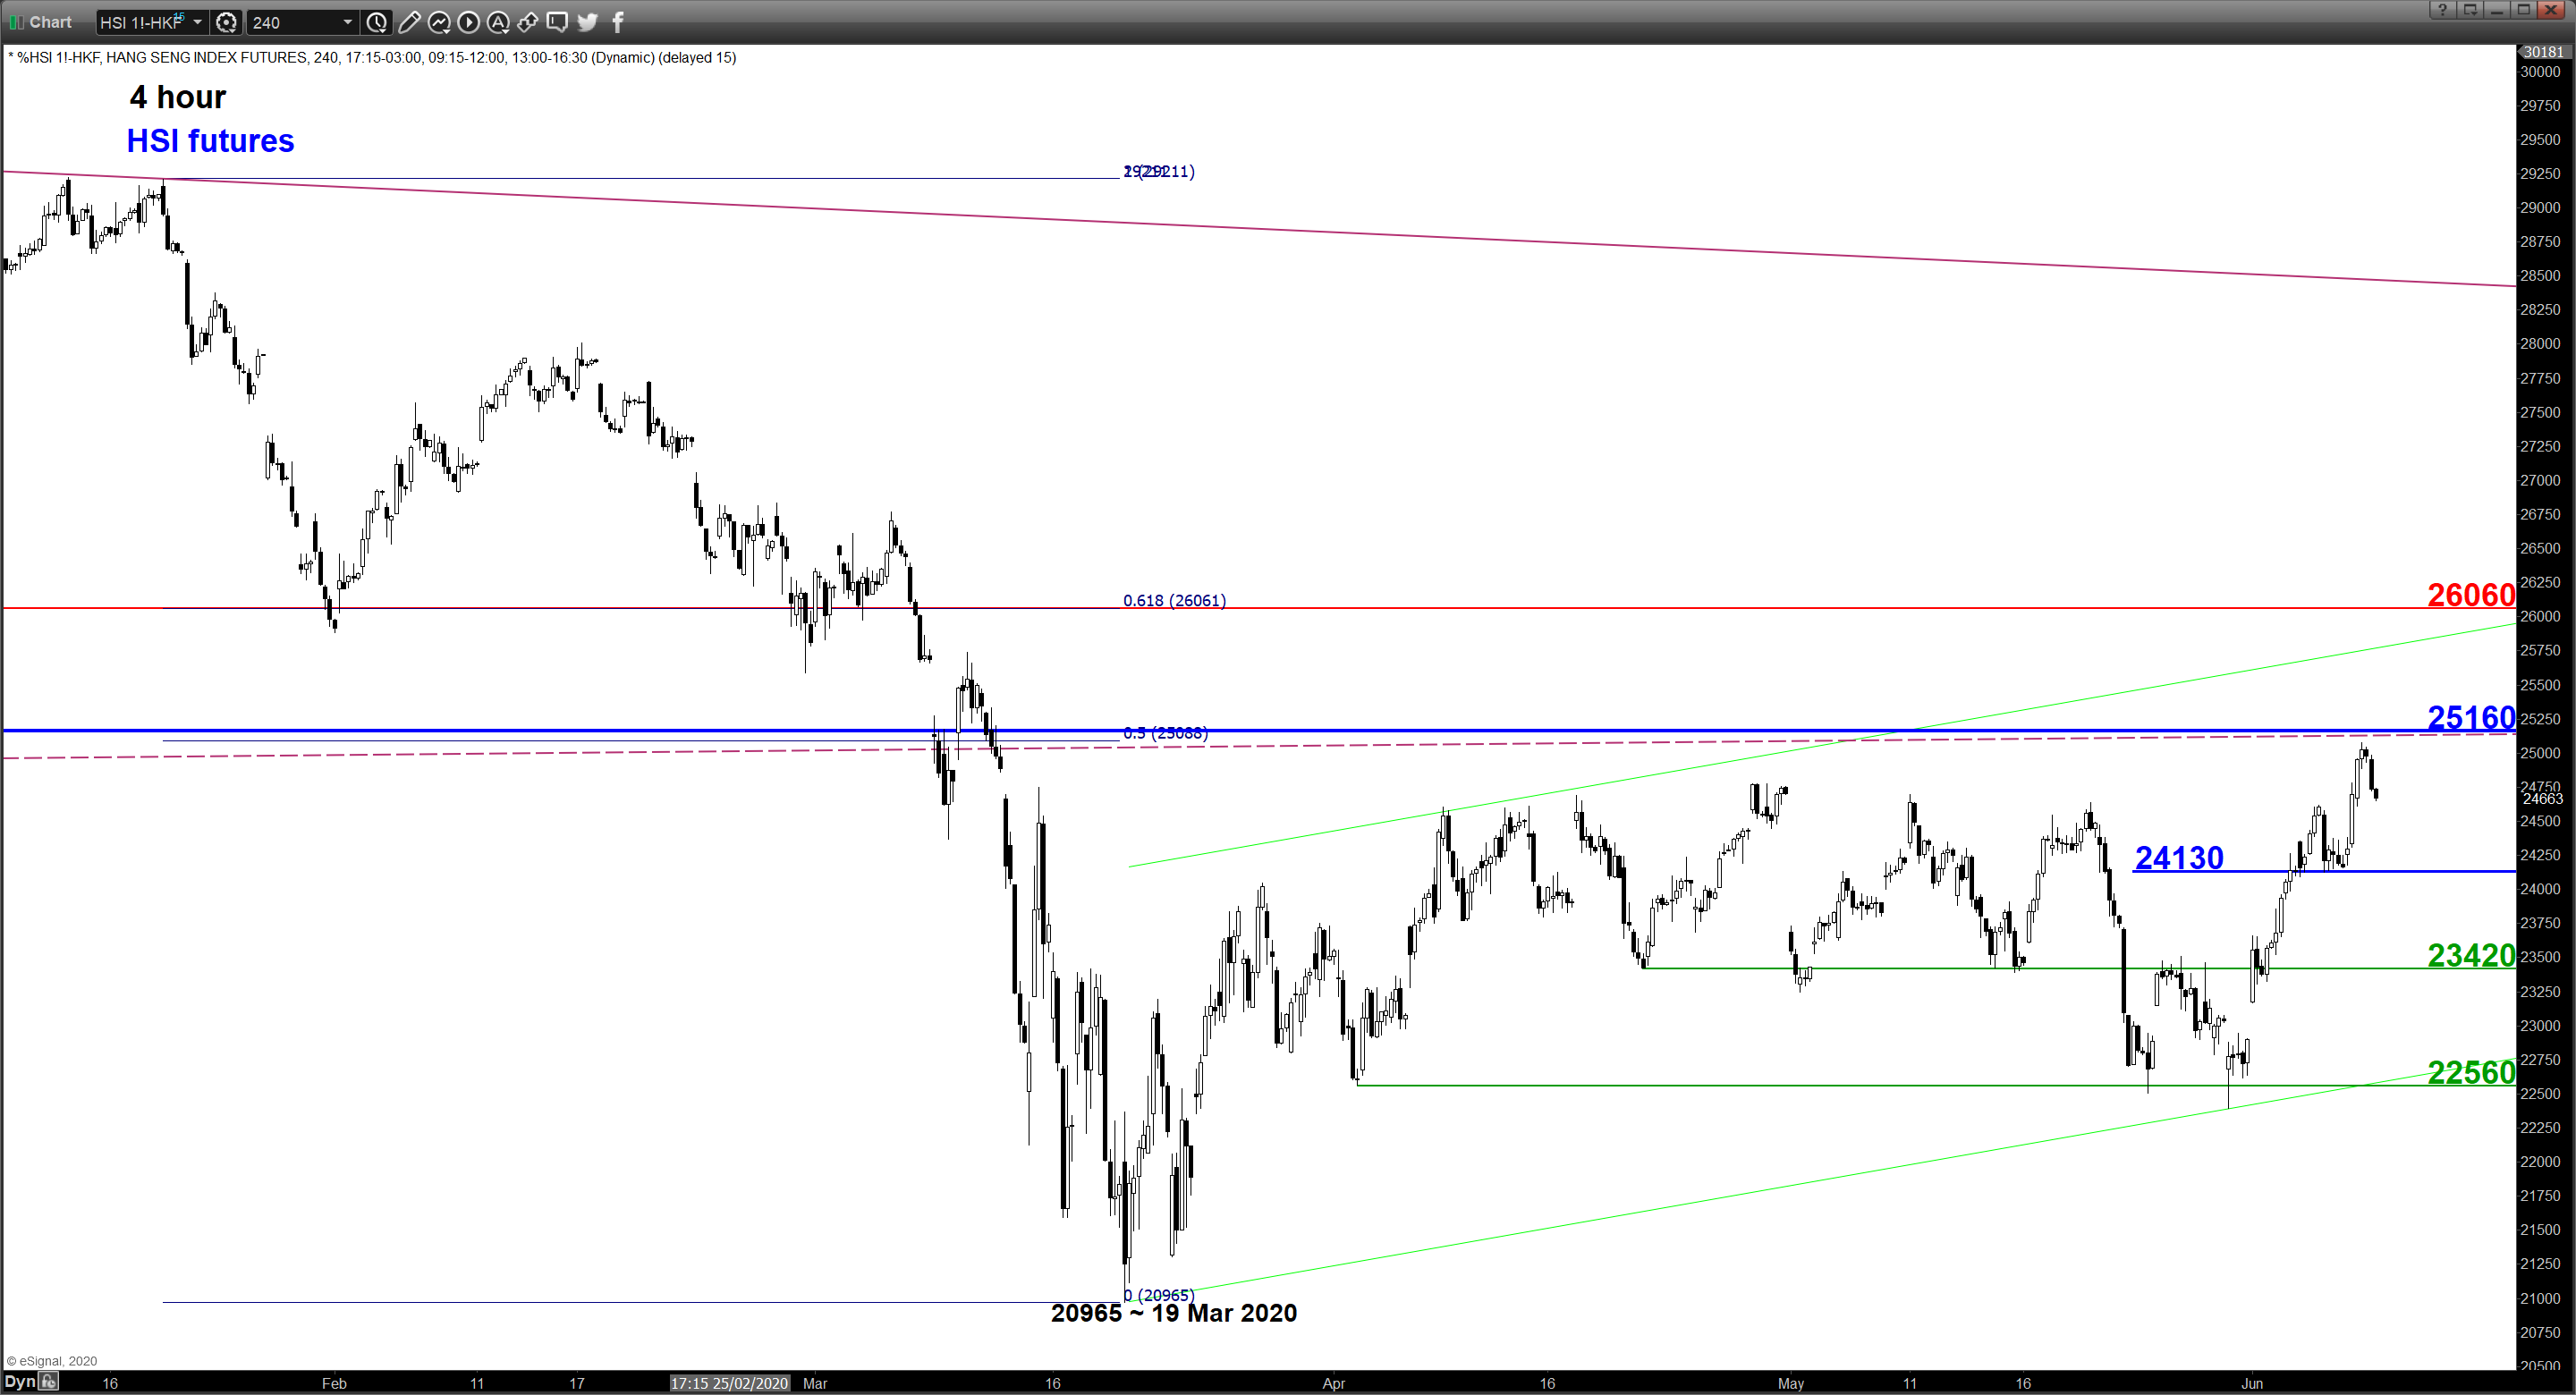
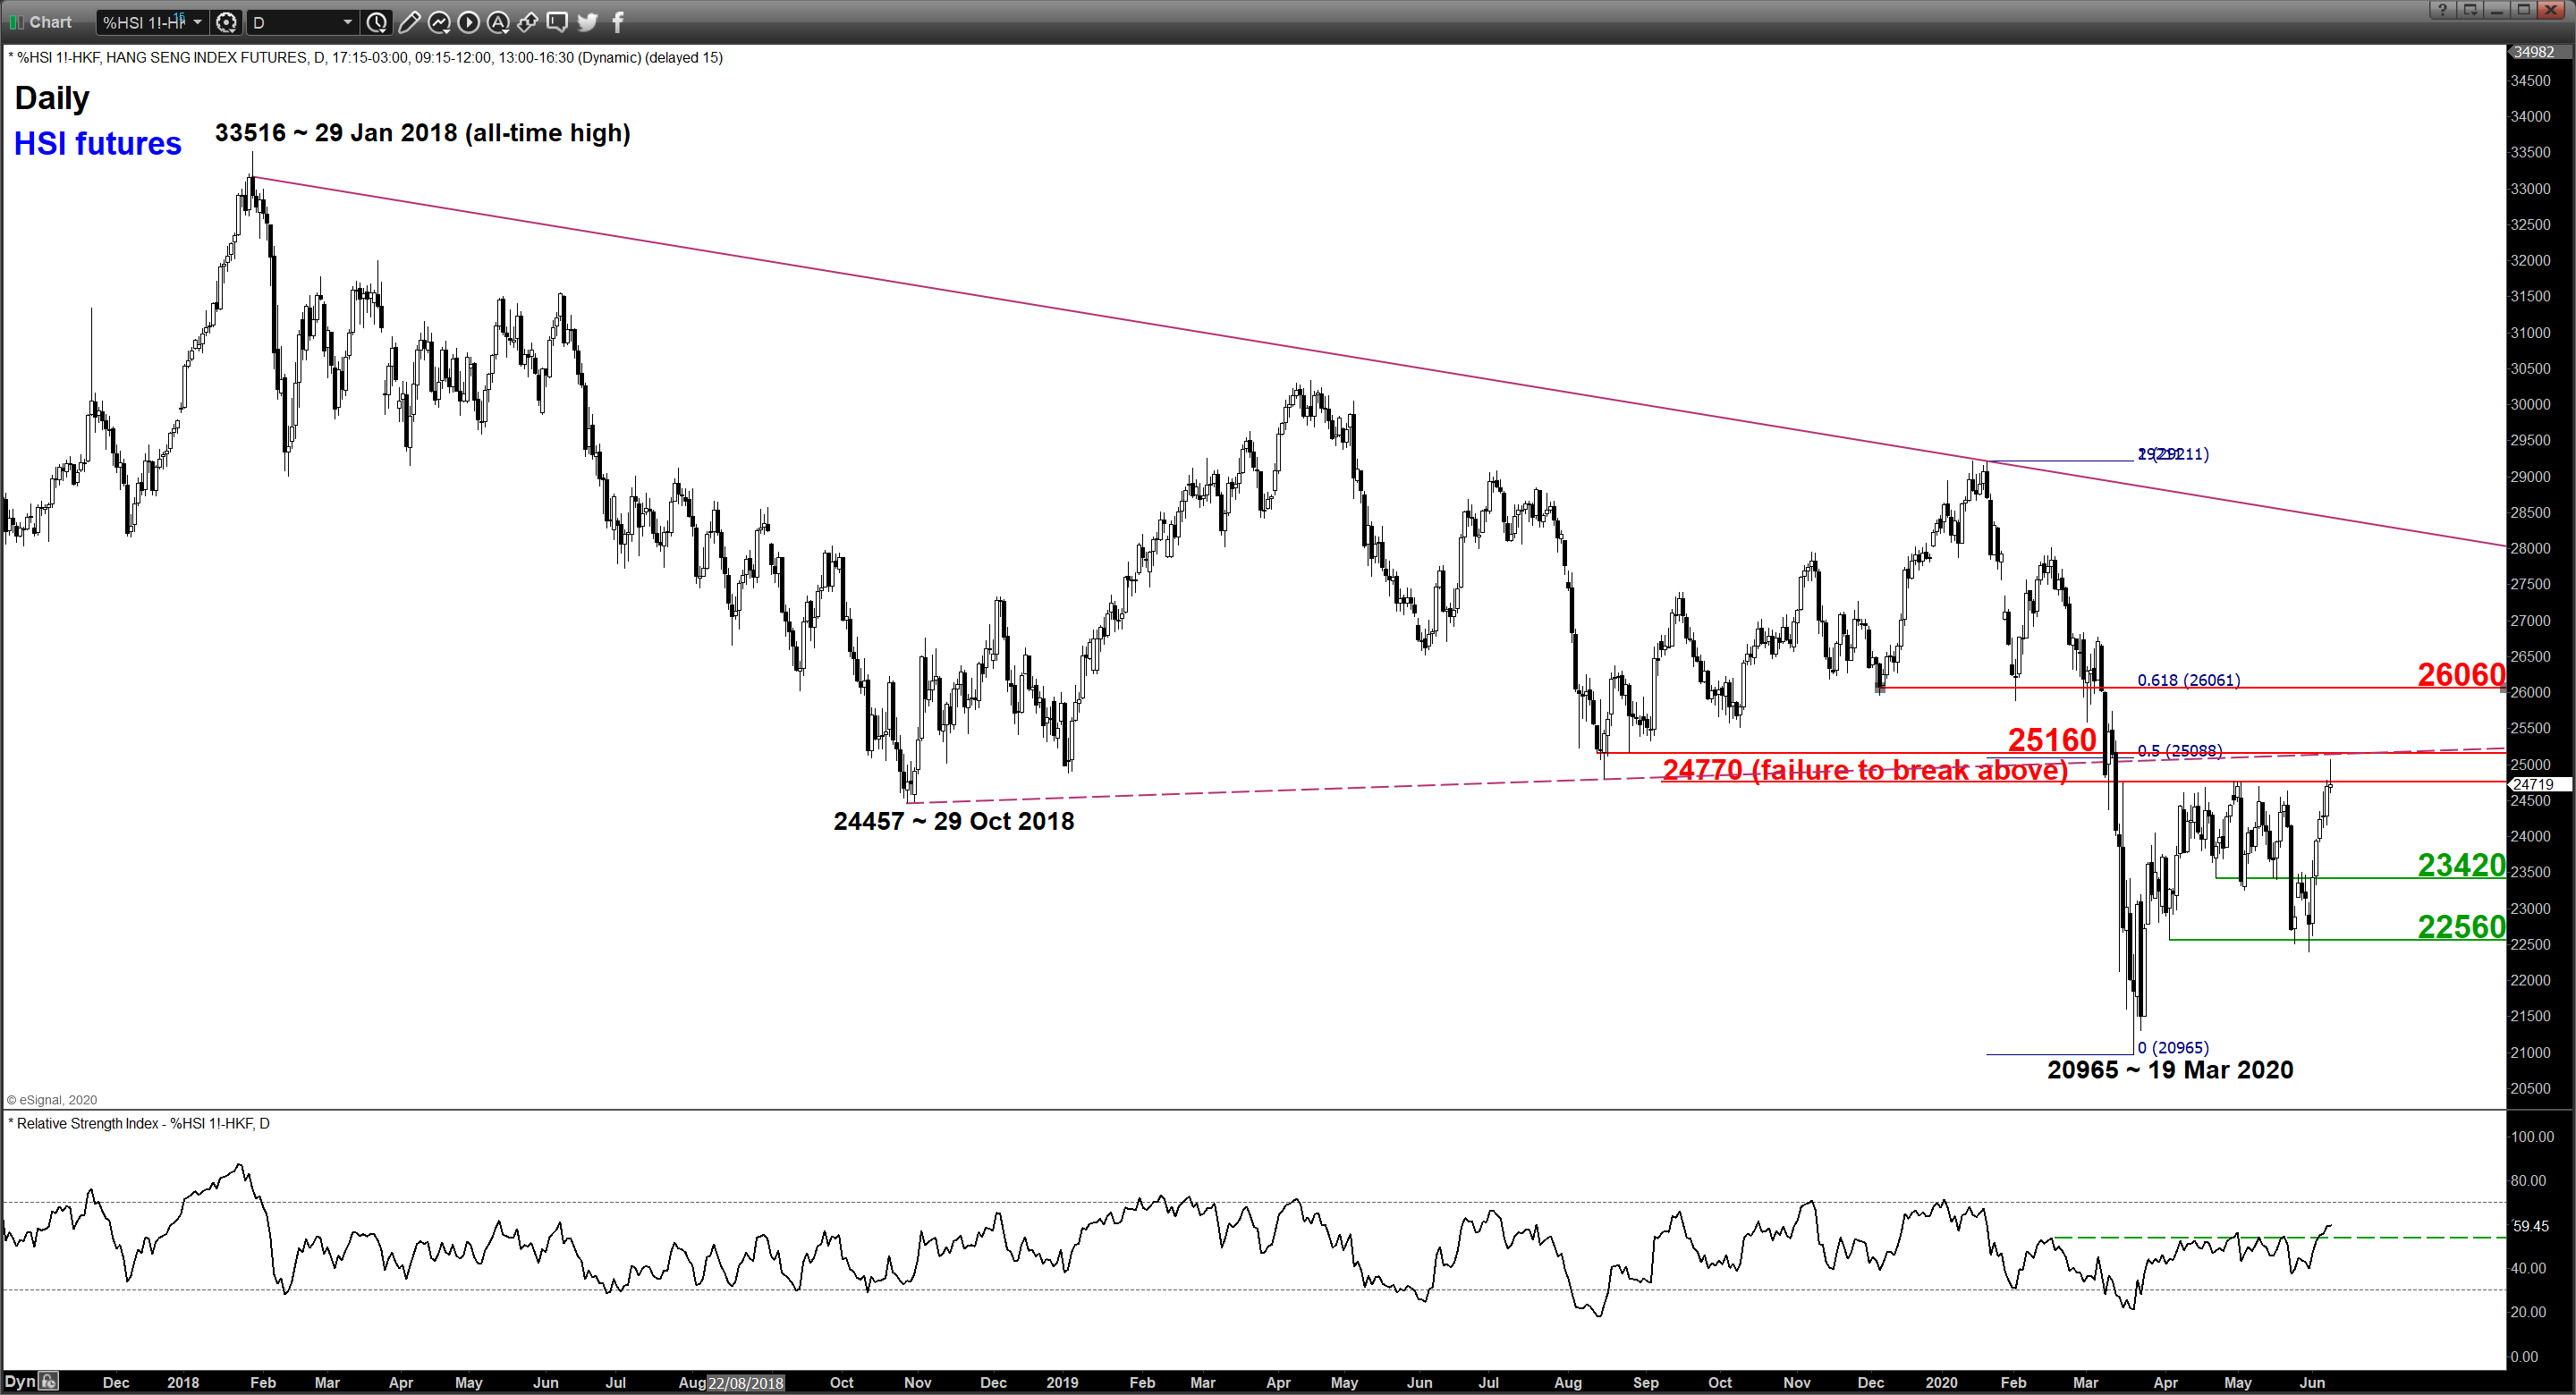
Hang Seng Index Futures: Mix Elements; Recent Push Up Rejected At Former Major Support
Key Levels
Resistances: 25160 & 26060
Supports: 24130 & 23420
Directional Bias
Mix elements, prefer to have a neutral stance between 25160 and 24130. Only a clearance above 25160 may see the continuation of the up move to target 26060 next.
On the flipside, failure to hold at 23420 sees the risk of a further decline towards the next support at 23420 (former congestion area from 22 Apr/27 May 2020 & the 61.8% Fibonacci retracement of the recent rally from 29 May to 05 Jun 2020 high).
DAX Futures: Evolving Within Ascending Channel
Key Levels
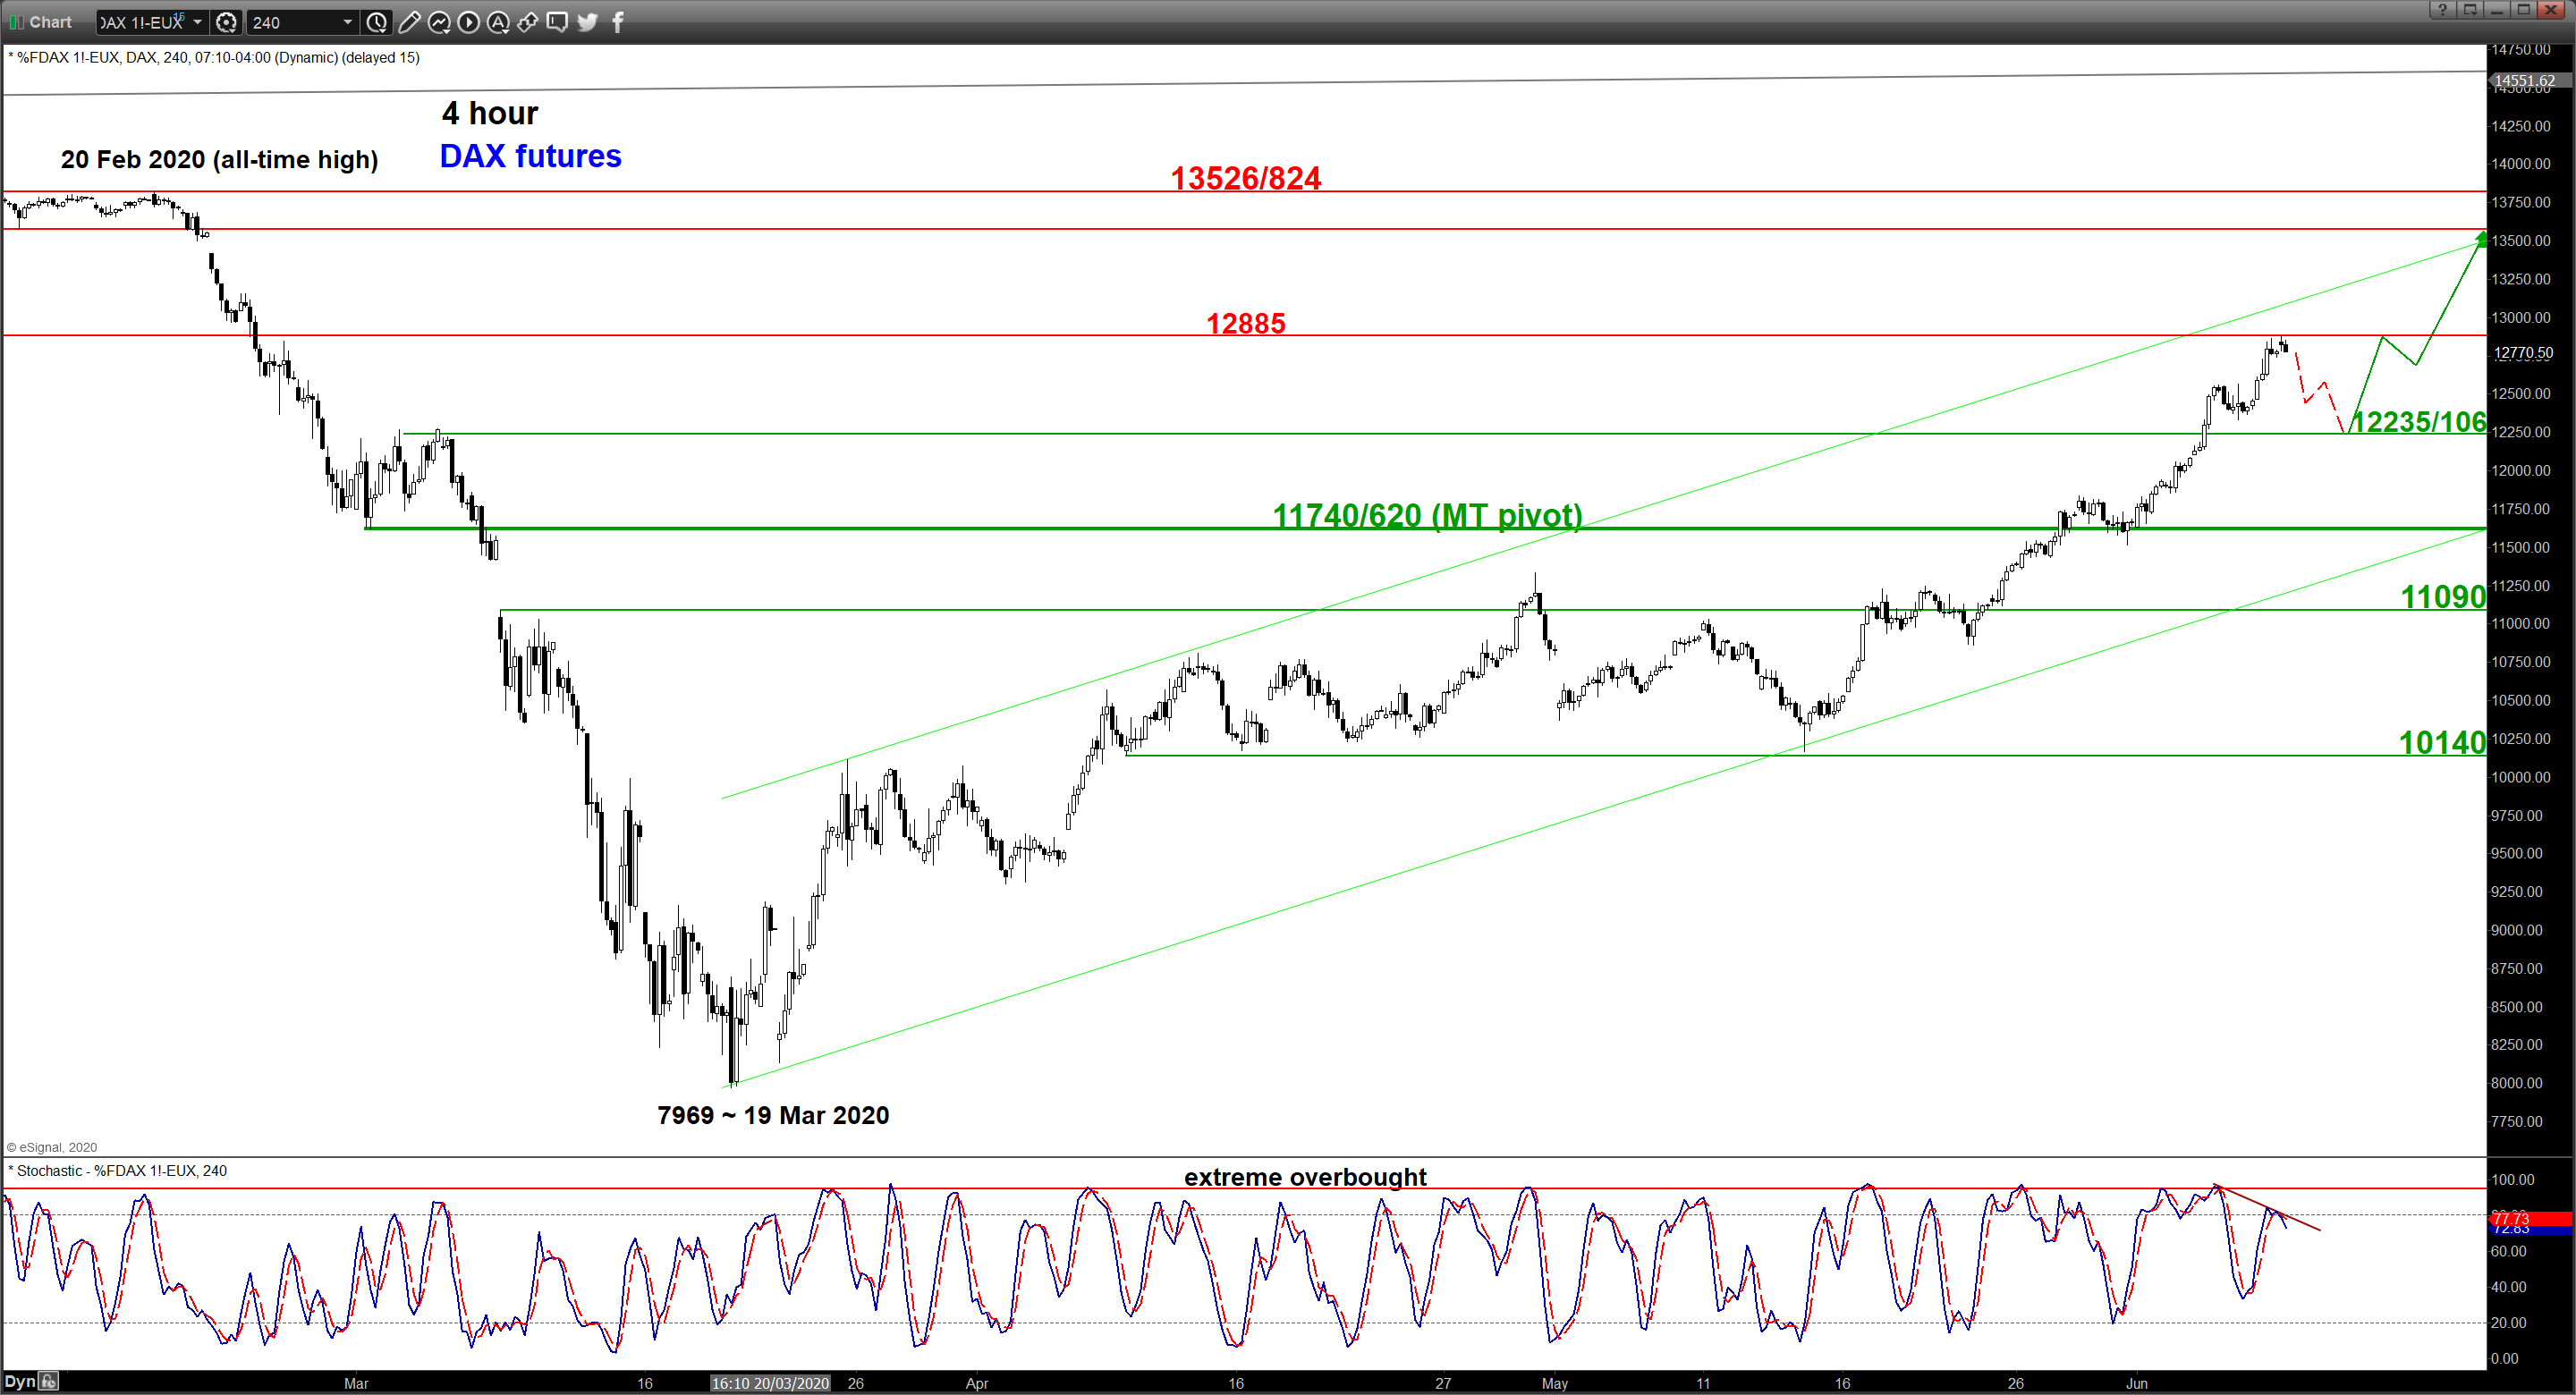
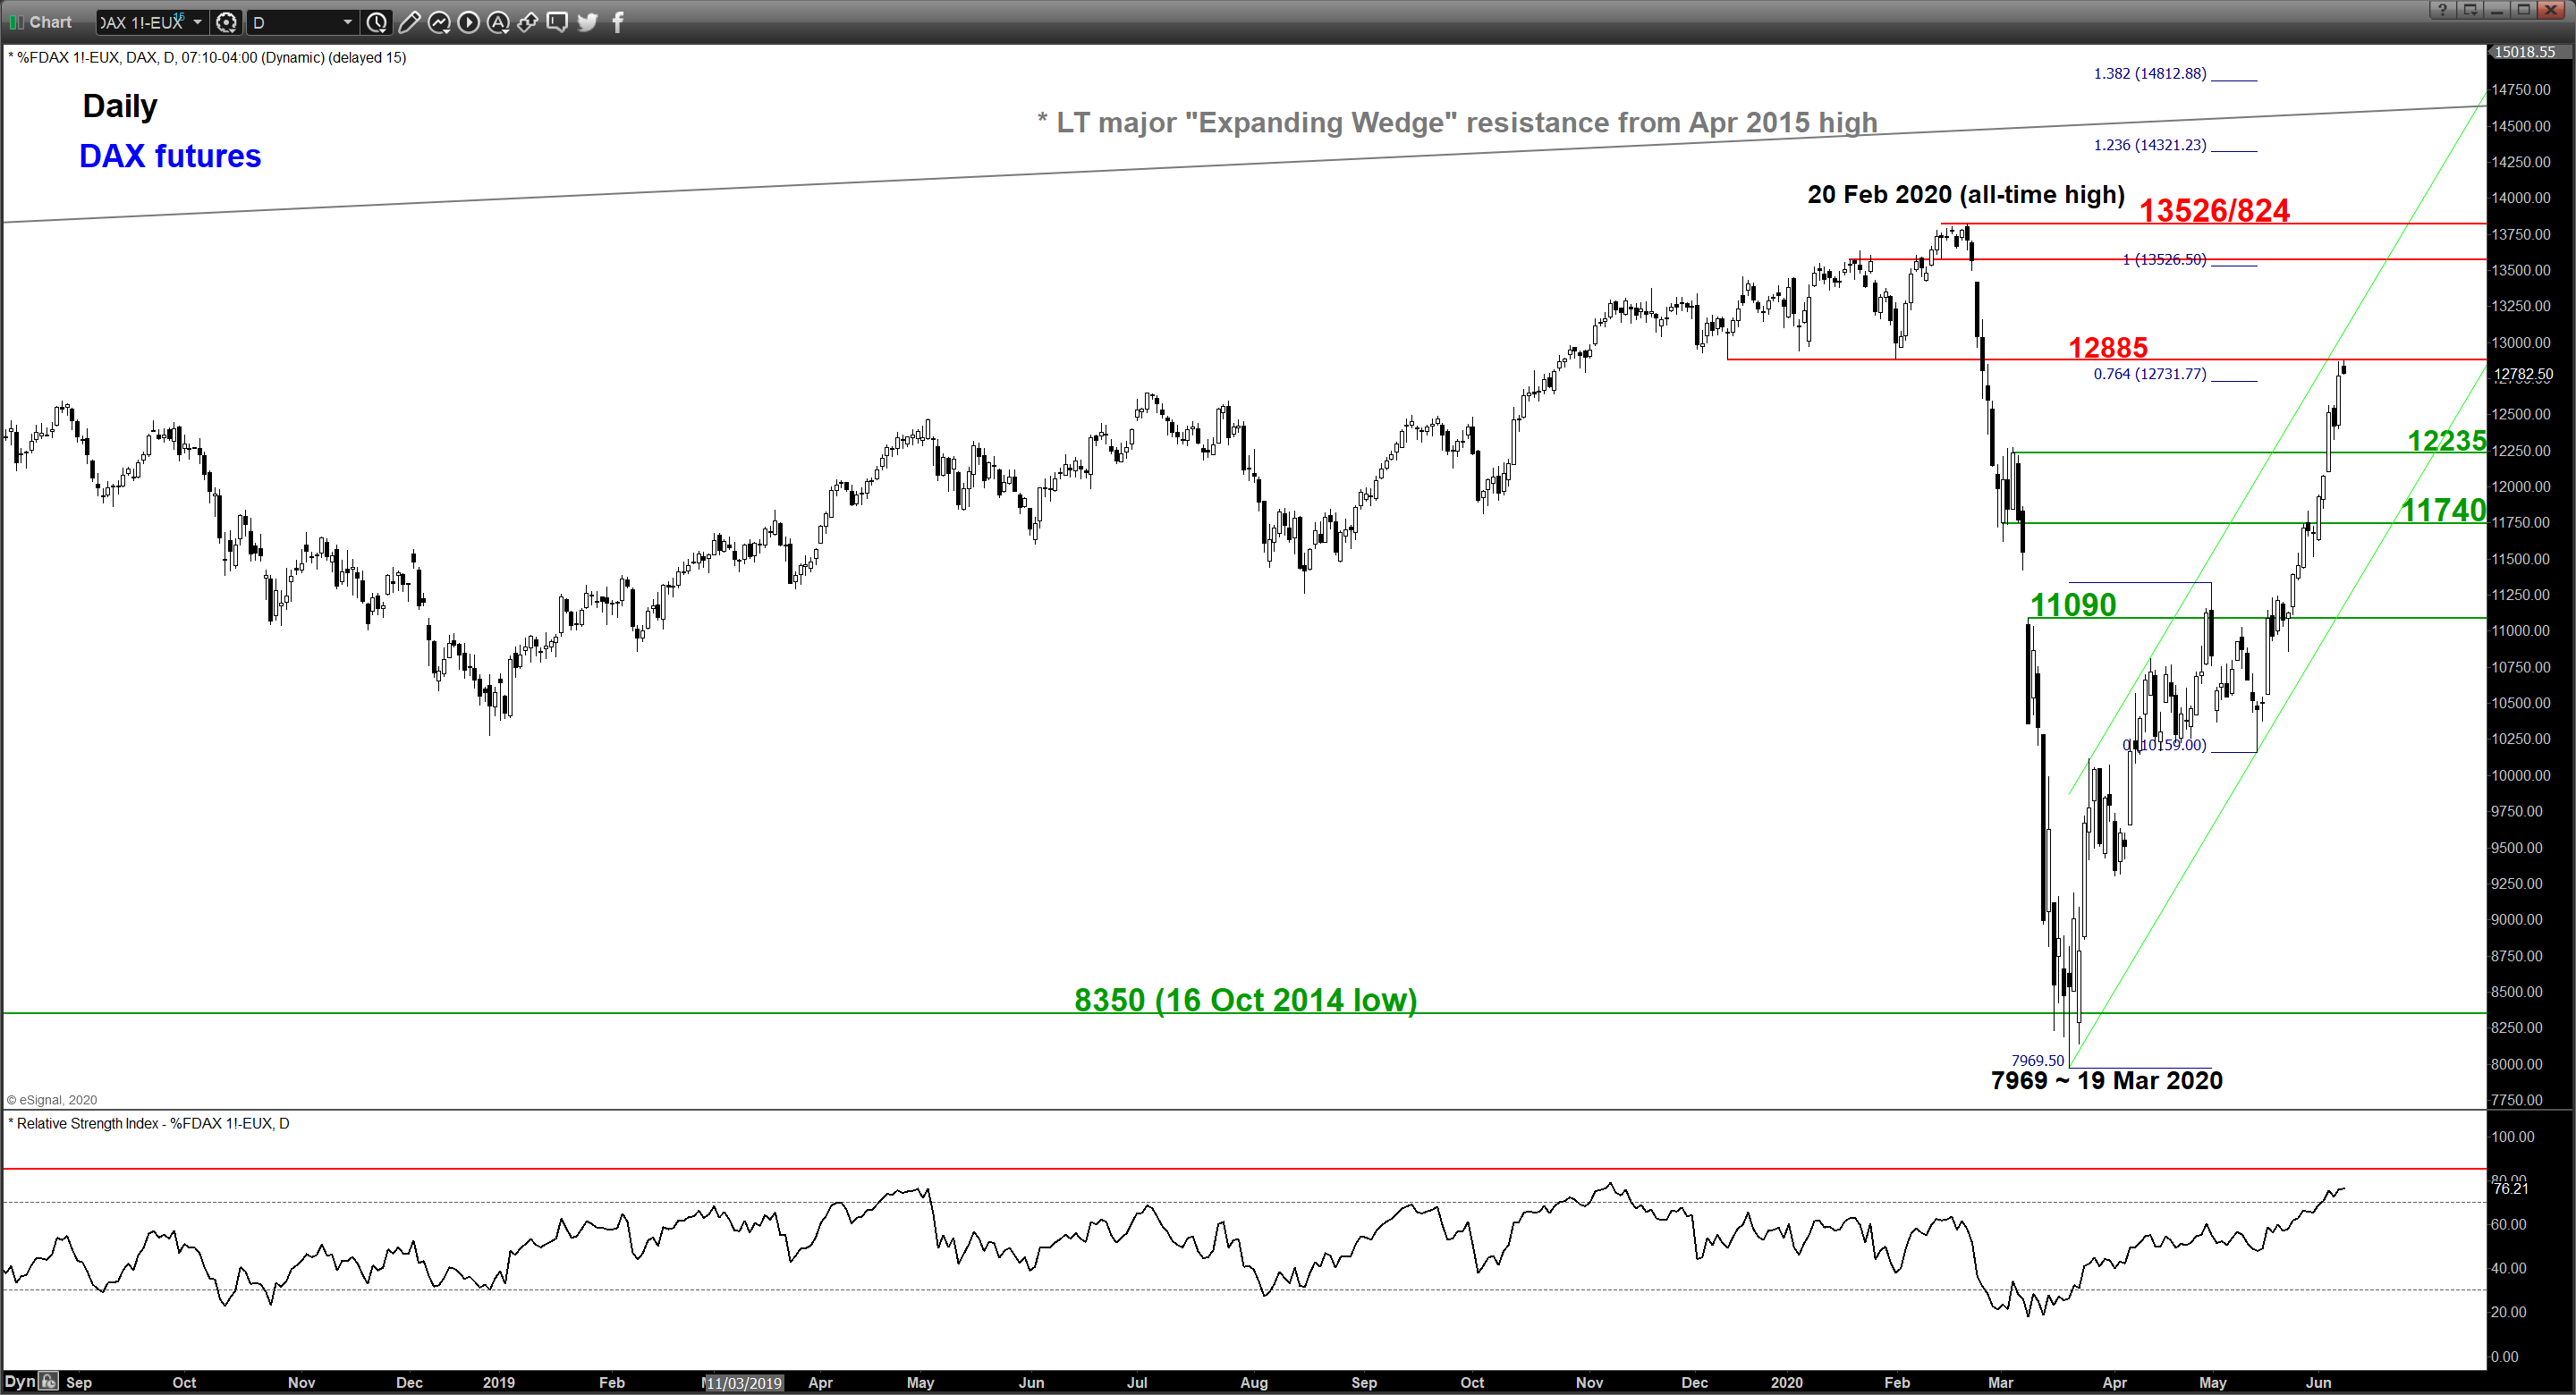
- Immediate support: 12235/106
- Pivot (key support): 11740/620
- Resistance: 13526/824
- Next supports: 11090 & 10140
Directional Bias
Bullish but risk of a minor pull-back below 12885 intermediate resistance due to overstretched short-term momentum (bearish divergence signal seen in the 4-hour Stochastic oscillator at extreme overbought level).
Expected short-term pull-back target is likely to be at 12235/106 with a maximum limit set at the 11740/620 key medium-term pivotal support before another potential impulsive up move materializes to target the 13526/824 zone.
On the other hand, a daily close below 11620 invalidates the bullish scenario for a multi-week corrective decline towards the next supports at 11090 and 10140 next.
Charts are from eSignal
