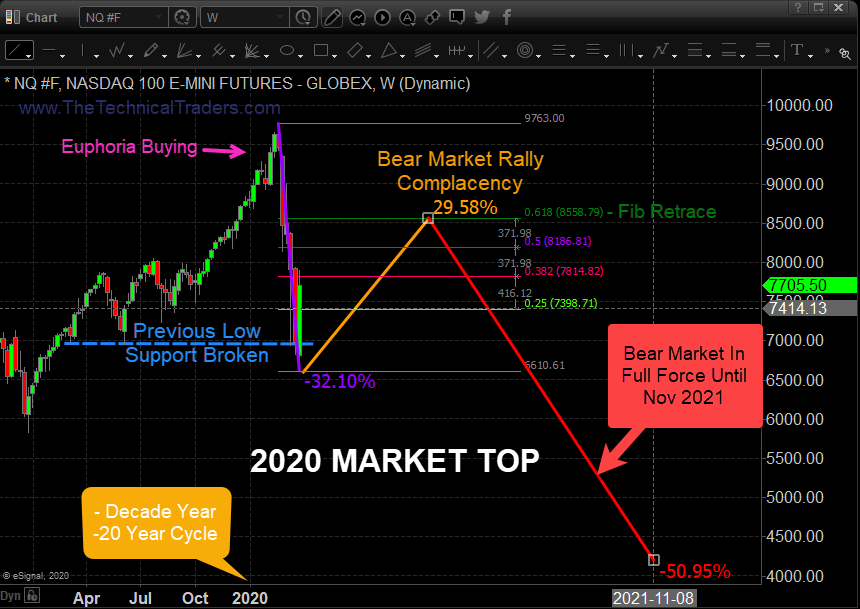
Recently, the Transportation Index and the S&P SPDR ETF (NYSE:SPY)setup topping patterns near the end of April 2020. In terms of technical triggers, these patterns need to see additional downside price confirmation before we can confirm the true potential for these setups. If they do confirm, we could be starting a new downside price trend fairly soon.
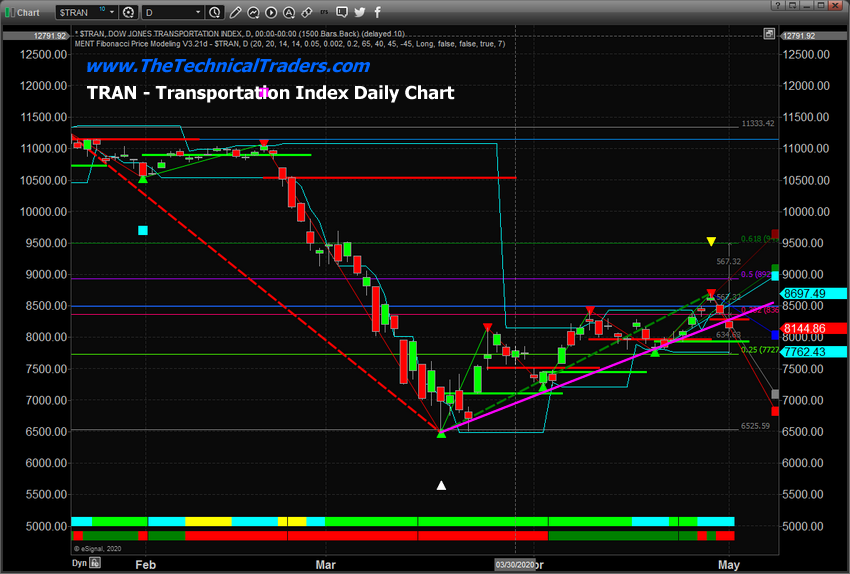
The recent market upside price move is dramatically different on the TRAN chart vs. the SPY (NYSE:SPY) chart. Even though the SPY price advance has mirrored the move in the ES and NQ, the TRAN upside price move has been more muted. This is because global economic activity has continued to stall and is not translating into active shipping and trucking activity. Remember, the Transportation Index helps us to understand the core levels of economic activity as parcels and products move around the globe.
Initially, the downside price break that occurred on Friday, May 1, 2020, which acts as a potential new downside price trend, yet we would want to see the recent lows from 8 days ago breached before we could consider this a truly confirmed trend. Technical traders may choose how and when to enter new trades/trends – yet we like to teach our followers to wait for true confirmation. I posted a short video about how I analyze the index for new trades here.
Transportation Index (TRAN) Daily Chart
On the TRAN chart, the recent lows near 7,762 would qualify as a breakdown price move. Thus, if the TRAN sells off below that level, then we would have a confirmed downside price trend expecting 6,500 to be reached again.
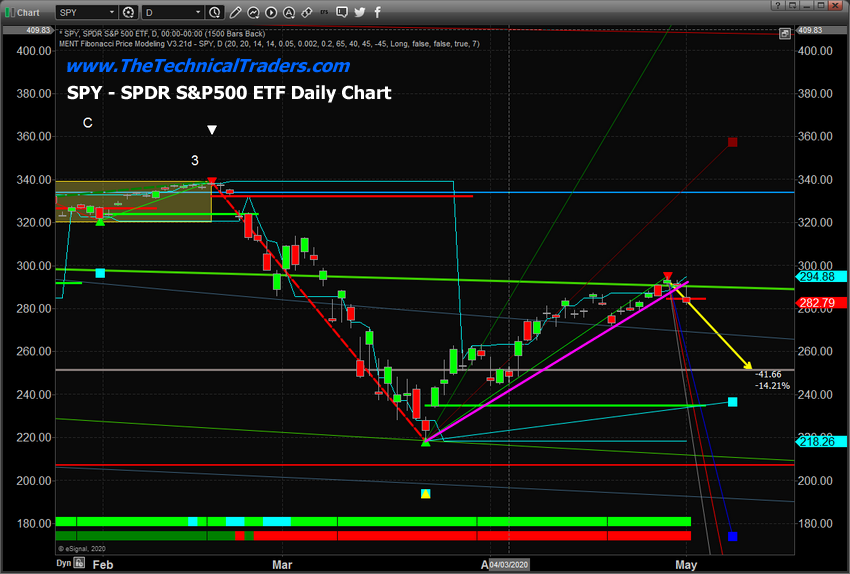
SPY Daily Chart
On this SPY chart, a similar type of Three River Evening pattern setup a nearly perfect top over the past four days. A confirmation appears to be valid on Friday, May 1, 2020. Yet, we would need to wait to see if the low price level near 272 is breached before we could confirm a true breakdown in this upward price trend.
Skilled traders should pay very close attention to what happens over the next five or more trading days as any new breakdown in price could be very volatile and aggressive. Our researchers believe the 251.50 level on the SPY would be the next downside target (see the YELLOW ARROW on this chart).
The heavy GREEN Arcing line near the recent peak is our proprietary Fibonacci Price Amplitude Arc representing a very key resistance level (1.618x). Notice how this level played a very key role in providing initial support in early March and is now acting as a major top/resistance area.
We could be in for a very big ride if a new breakdown begins soon.
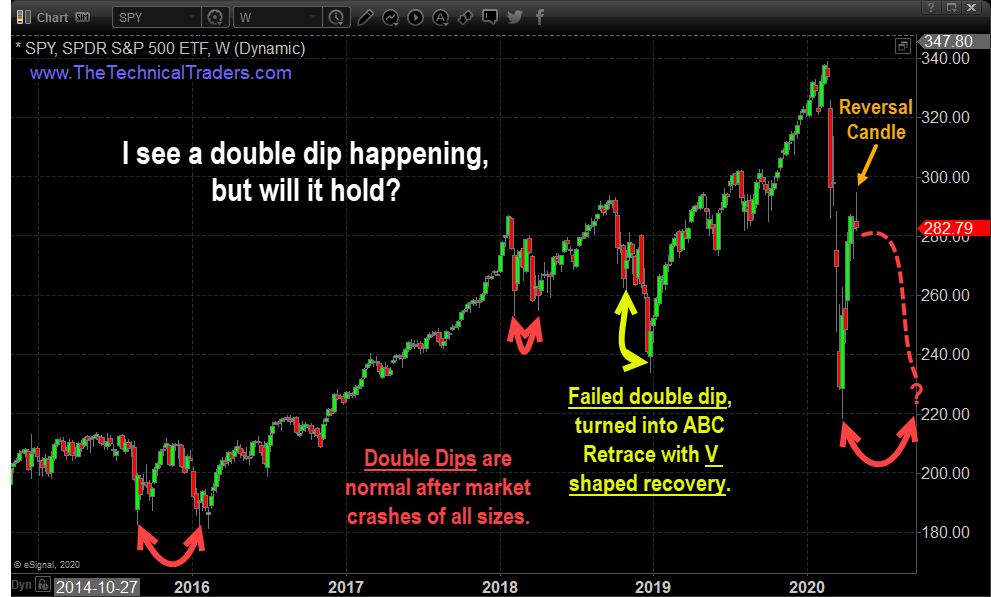
SPY Weekly Chart – Reversal Candle
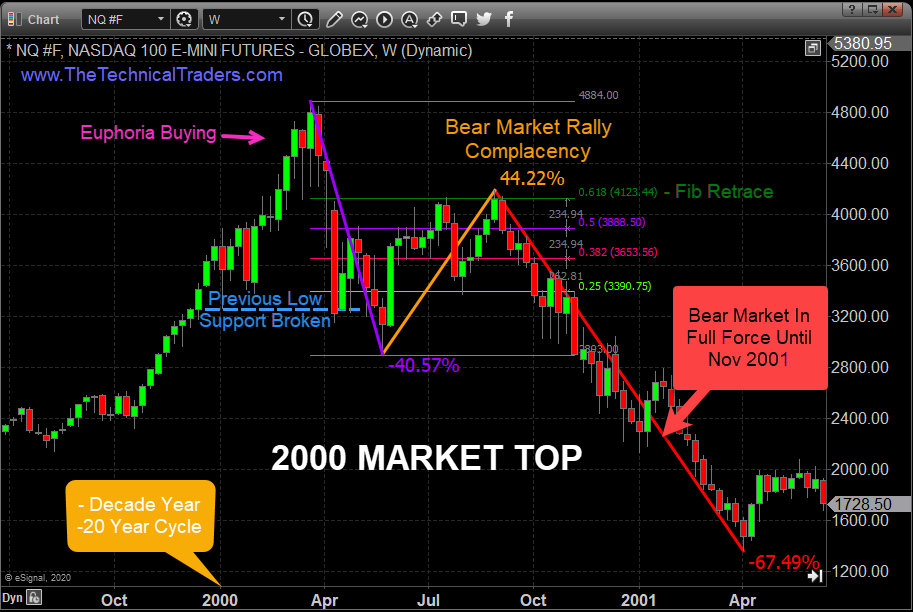
This 35% bounce in the SP500 I called many weeks showing how this very similar setup unfolded during the 2000 market top.
2000 STOCK MARKET TOP & BEAR MARKET THAT FOLLOWED
The chart may look a little overwhelming, but look at each part and compare it to the market psychology chart above. What happened in 2000 is what I feel is happening this year with the stock market sell-off.
In 2000, all market participants learned of at the same time was that there were no earnings coming from their darling .com stocks. Knowing they were not going to make money for a long time, everyone started selling these terrible stocks, and the market collapsed 40% very quickly.
What is similar between 2000 and 2020? Simple really. COVID-19 virus has halted a huge portion of business activity, travel, purchases, sporting events, etc. Everyone knows earnings are going to be poor, and many companies are going to go bankrupt. It is blatantly clear to everyone this is bad and will be for at least 6-12 months in corporate earnings; therefore, everyone is in a rush to sell their stock shares and are in a panic to unload them before everyone does.
2020 STOCK MARKET TOP IS UNFOLDING
As you can see, this chart below of this year’s market crash is VERY similar to that of 2000 thus far, it’s based on a similar mindset.
I posted this chart originally mid-March, expecting a 30+% rally from these lows before the market starts to fall and continue the new bear market, which I believe we are entering. Only the price will confirm the direction and major trend to follow, and since we follow price action and do not pick tops or bottoms, all we have to do is watch, learn, and trade when price favors new low-risk, high reward trade setups.
It does not matter which way the market crashes from here, we will either profit from the next leg down, or will miss/avoid it depending on if we get a tradable setup. Either cause is a win, just one makes money, while the worst-case scenario just preserves capital in a cash position, you can’t complain either way if you ask me.
