The Stock Exchange is all about trading. Each week, we do the following:
We also have some fun. We welcome comments, links and ideas to help us improve this resource for traders. If you have some ideas, please join in!
Review: Fear-Induced Trading Mistakes
Our previous Stock Exchange discussed Fear-Induced Trading Mistakes. We noted the market had hit a patch of volatility, and asked whether it was an opportunity to “buy the dip” or if it was the start of a momentum shift and an extended market decline? We also noted that the media’s intense focus on the US/China “trade war” and the federal reserve’s interest rate posture were making it hard for some traders to sit idly by without taking at least some kind of action. And that this is when fear induced mistakes can occur.This Week: The Beginning Or End of the Sell Off?
The market resumed its downward selling pressure this week as the Dow declined nearly 400 points on Monday.
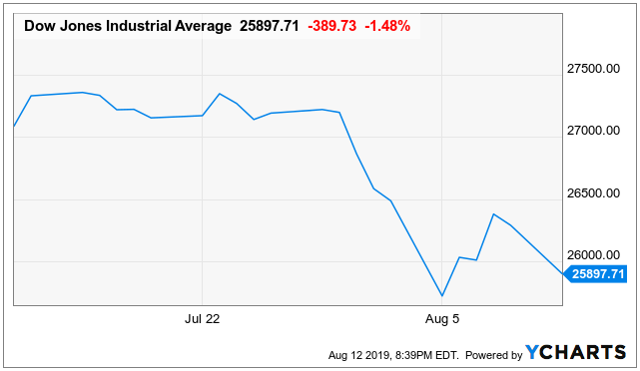
And the news headlines continue to be dominated by the fed’s monetary policy decisions and the US-China “trade war.” But the big question right now is whether this is the beginning or end of the sell off? Is now a “buy the dip” opportunity or a “step aside and look out below” opportunity?
Arguably investors and traders should always stick to their long-term plans, but perhaps that is better advice for investors than it is for traders.
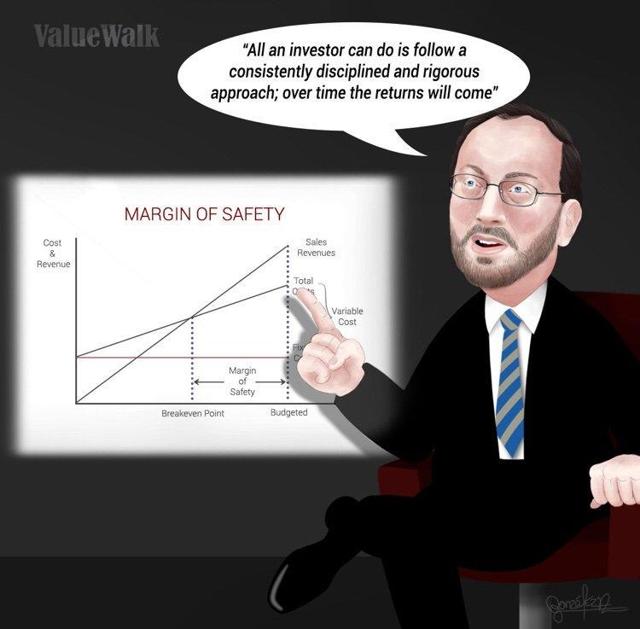
Seth Klarman (pictured above) is known as a brilliant “buy the dip” value investor, but not necessarily a trader (the main difference being investors generally have much longer time horizons than do traders). And for a counterpoint, Trading psychologist, Dr. Brett Steenbarger suggests:
We commonly hear the advice that traders should “stick to their plans” and that planning and remaining true to plans is the epitome of discipline and the key to success.
It ain’t necessarily so.
Steenbarger goes on to use an analogy:
If I meet with a person for the first time in a counseling session, I don’t go into the session with a treatment plan. That would be crazy. Rather, I listen to what the person says, look for patterns in the issues they present, and then come up with an idea of what might be going on. I’ll run that by the individual and, together, we’ll develop a plan for addressing those problems. Very often the plan will be grounded in the kind of helping that research has found to be useful for the issues presented.If I were to start the session with a plan for intervention, the therapy would be doomed from the outset.
So what is a trader to do? For starters, you need to know yourself. For example, do you have a history of panicking and making bad trades when volatility increases? Or, on the other hand, do you live for volatility spikes because that’s when you’ve had the most success.
You might consider changing your cash level in such situations. For example, Seth Klarman (mentioned above) is known for sitting on large amounts of cash in the private investment partnership he manages, so he has plenty of dry powder when dramatic sell offs create buying opportunities. Alas, our current market sell off may be nerve racking, but it is no where near a “dramatic sell off” by historical standards.
As we will review later in this report, our specific trading models have differing trading styles ranging from “dip buyer” to “momentum trader.” However, before getting into some specific recent trades, here is an update on their performance.

Model Performance
We are sharing the performance of our proprietary trading models as our readers have requested.Worth a reminder, our models increase and decrease their cash levels based on market conditions, so the performance in the table can appear more dramatic than reality, especially when considering the strategies are often combined with some of our longer-term strategies as well.Expert Picks From The Models
Note: This week’s Stock Exchange report is being moderated by Blue Harbinger, a source for independent investment ideas.
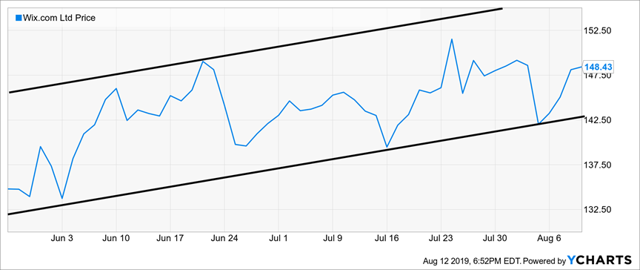
Roadrunner: I bought shares of Wix.com (WIX) recently on 8/7. As you know, I like to buy stocks in the lower end of a rising channel, as you can see in the following chart.
BH: Sounds like you think this market wide sell of is about over then? I know you typically hold for 4-weeks. I know you are mainly a momentum trader, and it seems you think this sell off just created a good entry point for you before this upward market momentum resumes.
RR: It’s a little more complicated than that. For starters, I trade individual stocks, not entire market indexes. And generally speaking, I like to buy in the lower end of a rising channel. But more specifically, I look for a certain type of situation (some call it a pattern, others may call it a setup, etc.) where the probability of a particular action is not a matter of chance (50/50) but has been historically noted to result in a greater tendency towards a particular outcome. “Trending in a channel” is one such situation. An equity will often “cycle” between the upper and lower bounds of that channel for substantial periods of time.
My model design attempts to take advantage of this property by identifying stocks trending in an upwards channel and waiting until the stock price drifts to the lower bound, making it a candidate for purchase. These types of situations have a relatively high probability of positive outcome with a reasonable profit potential. Wix can be seen to be in this type of a situation. This is a short-term trade that has traditionally shown profitability when the right conditions have been met. One way or another, I’ll be out of it shortly – usually after about 4 weeks.
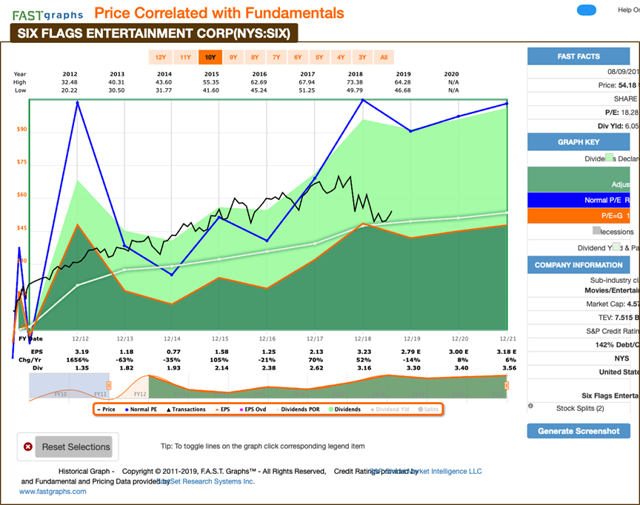
BH: Well that’s all interesting, and I appreciate the explanation. But do you even know what Wix does? The company develops and markets an Internet service that allows users to create Web content in the US and internationally. For your reference, here is a look at the F.A.S.T. Graph.
Felix: Interesting trade Road Runner. Personally, I sold my shares of Beacon Roofing Supply (BECN) on 8/8 for $28.23. You may recall I purchased the shares on 7/5 for $36.58.
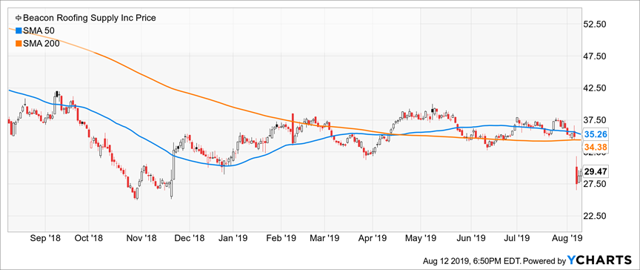
BH: That is a painful trade. However, I know no one wins all of their trades all of the time. Remind us, what is your trading strategy, Felix?
Felix: You might recall my strategy is also based on momentum, and my typical holding period is considerably longer than the other models, often up to 1 year or slightly longer.
BH: Beacon Roofing Supply distributes residential and commercial roofing materials, such as asphalt shingles, synthetic slates and tiles, clay and concrete tiles, slates, nail base insulations, and metal roofing, to name a few. Here us a look at the F.A.S.T. Graph.
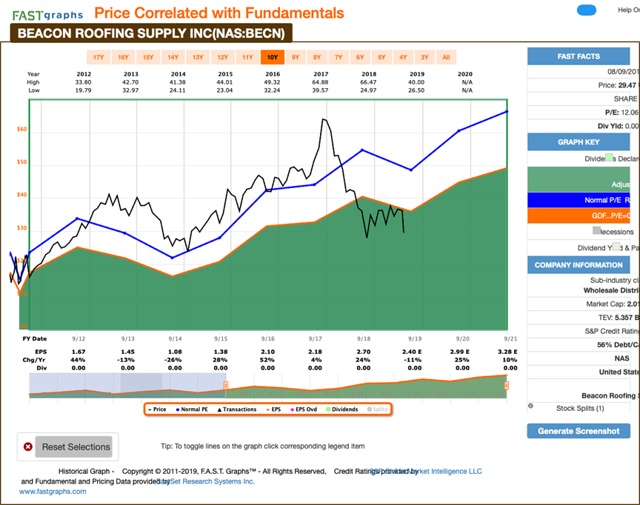
Felix: Thanks for that information. Market conditions were not in my favor for this trade so I cut my losses and exited.
Conclusion
By historical standards, the uptick in market volatility over the last week is not extreme, but it can still be quite uncomfortable for traders. And while some of our trading models (e.g. Holmes) see this as a buying opportunity, other traders view it as an opportunity to take a little risk off the table. Ultimately, it is extremely important to know yourself as a trader, including how you act under different market conditions. Under what conditions are you a strong trader, and under what conditions do you make mistakes. All you can do, over time, is stick to the strategy that works for you (whether it is dynamic or un-waveringly disciplined) and the returns will eventually come.
