The Stock Exchange is all about trading. Each week, we do the following:
We also have some fun. We welcome comments, links and ideas to help us improve this resource for traders. If you have some ideas, please join in!
Review: How Tight Is Your Risk Budget?
Our previous Stock Exchange asked the question: How Tight Is Your Risk Budget? We noted that taking on too much risk can be a fatal mistake for traders, but do you even know how much risk you’re taking? Whether it be through trailing stop orders, sector and style diversification, or cash levels, there are many different ways to allocate your risk budget.
This Week: How Big Will The Next Market Pullback Be?
Many traders wait patiently for the next market sell off because it creates an opportunity to “buy low.” However, how low is low enough? How far does the market have to fall before it officially becomes a buying opportunity? Traders run the risk of being too early (e.g. the market could fall a lot farther) or too late (e.g. they miss the buying opportunity because they were waiting for the market to fall just a little farther before entering a position).
This week, we review the trades of our trading models Holmes and Road Runner. Both models attempt to buy low, but in very different fashions. For example, Holmes is more of a value approach whereby he essentially is looking for big attractive “dip buying” opportunities. Whereas Road Runner, combines “dip buying” with momentum (he essential tries to take attractive positions when prices are in the lower end of a rising channel). Holmes and Road Runner are very different variations of trying to take advantage of a market pullback.
But just how big and how prolonged will the next market pullback be? For example, the market experienced quite a run up in the late 1990’s before the tech bubble finally burst in the early 2000’s. And while timing that market sell off was challenging, some investing pundits are now seeing similarities between current market conditions and the tech bubble. For example, just this week, Jim Cramer said:
“You have to be skeptical of markets, entire markets, where more and more stocks are valued on something other than earnings. This is what happened during the dot-com crash — you had tons of companies that were trading on eyeballs and page clicks,” he said. “The more stocks that trade on weird metrics, the more likely it is that the market’s overvalued.”
And of course the Tech Bubble (as hard as it was to predict the exact timing of the burst) paled in comparison to the financial crisis of 2008-2009 (which seemed to catch many investors and traders by surprise).
Of course, the tech bubble and the financial crisis were very large events, and there is plenty of shorter term volatility and trading opportunities to take advantage of. However, the tech bubble was big, the financial crisis was bigger, and the next crisis (whenever it may arrive) could be even bigger. Investors and traders alike are wise to only take on risks they can handle by appropriately allocating there assets among stock trades, bonds, cash, and whatever else meets their personal needs based on their personal situation.
On the other hand, there are those that constantly warn of bubbles and impending gloom and doom in the markets. Of course they will eventually be right (the market doesn’t just go straight up forever). And when it does happen, boy will we hear about it. For example, Jesse Colombo (twitter handle: “TheBubbleBubble,” has a history of constantly warning investors of bubbles growing almost everywhere.

The reality is, no one knows when the next big market pullback is coming. No one knows how big or prolonged it may be. But we do know pullbacks happen all the time (small ones and occasionally big ones) and that the market has recovered from every historical pullback so far to reach new all time highs. Pullbacks can be outstanding opportunities, so long as your strategy is catered to meet your individual needs, time horizon, and volatility tolerance.
Model Performance:
I am suspending the publication of the performance table. While performance has lagged since last fall, that is not my main reason.
The purpose of the Stock Exchange series is to feature trading methods, problems, and some specific ideas. We added the table when some readers requested it, partly to compare the different models. Instead of being a supplement that would allow readers to cheer for a specific approach, it became the focal point for many.
I also discovered that some readers thought this to be a performance report for all of the NewArc programs. That is definitely not the case. We invite interested readers to reach us directly about any of our programs. My own fundamental choices often contrast sharply with those of the model, as readers of my WTWA series would expect.
Meanwhile, our trading models, including some new additions, will continue to feature approaches and ideas each week. This has always been a sampling of what we are doing, chosen for generating interest and discussion. I hope readers will continue to enjoy the series in the intended spirit.
Expert Picks From The Models
Note: This week’s Stock Exchange is being edited by Blue Harbinger. Blue Harbinger is a source for independent investment ideas.
Holmes: I bought shares of The Boston Beer Company (SAM) on 9/17. How do you feel about that trade?
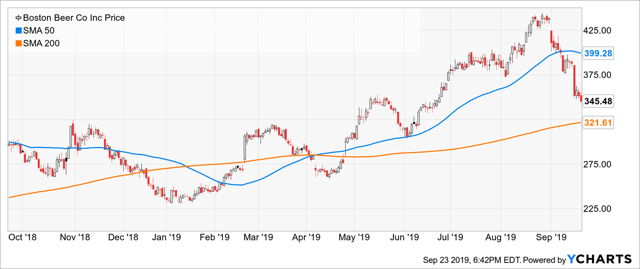
Blue Harbinger: I know you are a computer-based trading model, Holmes, so I am guessing you didn’t buy it because you like beer.
Holmes: Correct. I purchases for technical reasons. Specifically, I am a dip buyer, and I like to buy attractive pullbacks, as you can see in the chart above.
BH: I see the pullback you’re talking about, and it looks attractive so long as you believe in the fundamental of Boston Beer (the maker of Samuel Adams) over the long-term. Here is a look at some fundamental data in the following F.A.S.T. Graph.
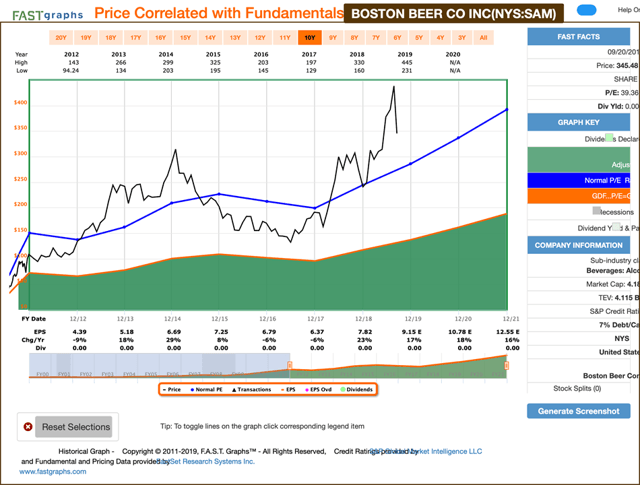
Holmes: My typical holding period is around 6-weeks, so the long-term fundamental data is less interesting to me. Technically speaking, the recent pullback in the price of SAM shares isn’t going to last long.
BH: Interesting trade. Thank you for sharing. And how about you, Road Runner–do you have any interesting new trades whereby you’ve purchased something on a pullback?
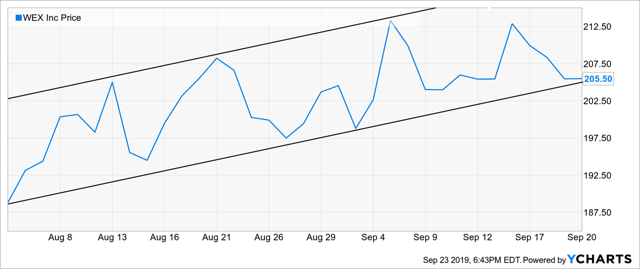
Road Runner: Hello. And sort of. I do have a new purchase to share. And I did buy on a pullback, sort of. Specifically, I bought shares of Wex Inc (WEX) on 9/20 when it was trading at the lower end of a rising channel, as you can see in the following chart. That’s sort of buying on a pullback (a pullback within a rising momentum channel).
BH: Interesting. Wex provides corporate card payment solutions. It operates through three segments: Fleet Solutions, Travel and Corporate Solutions, and Health and Employee Benefit Solutions. Here is a look at the F.A.S.T. Graph.
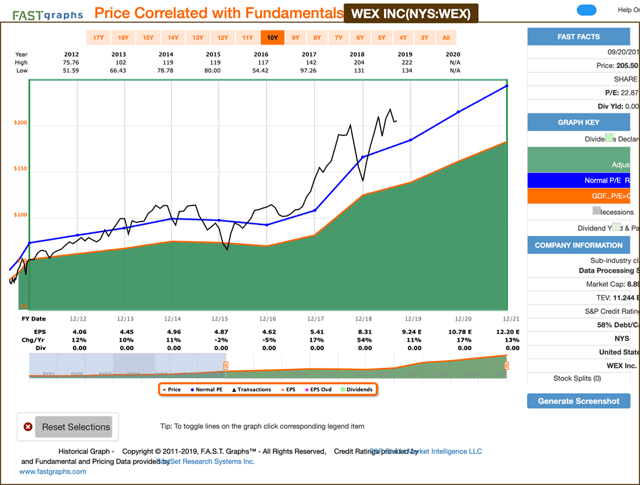
RR: Thanks but I typically hold for only 4 weeks, so the fundamentals are less important to me. I am a technical trading model.
BH: Ok. It seems the dip that you bought has only lasted a few days, and it exists within a rising channel. On the other hand, the dip that Holmes bought has lasted significantly longer.
RR: That’s correct. There are a lot more data points that go into each trade. But essentially, yes–we have different styles and time horizons for our “buy low” opportunities.
BH: I guess I am just struggling with how you know how long each dip will last, and why you believe it will actually recover. For example, energy has been the worst performing market sector over the last year, but how do you know if and when that will change. It seems like you’d want some sort of fundamental data to support your thesis that things will get better (for example, I can think of lots of big safe dividend energy sector stocks that have recently sold off, but should likely recover due to the fundamentals).
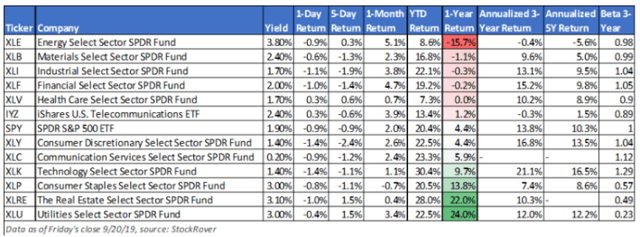
RR: I can appreciate your concerns, but technical trading is an entirely different approach to the markets. You can request more info from Jeff using the link near the end of this report.
Conclusion
Sell offs and pullbacks elicit different reactions from market participants–some good and some bad. This week, we’ve highlighted two technical trades, both based on a pullback, but pullbacks of different types and time horizons. There are multiple ways to profitably play market pullbacks, depending on your situation, market conditions and your personal risk tolerance. Have you been playing market pullbacks recently, or are you waiting for different conditions before pulling the trigger?
