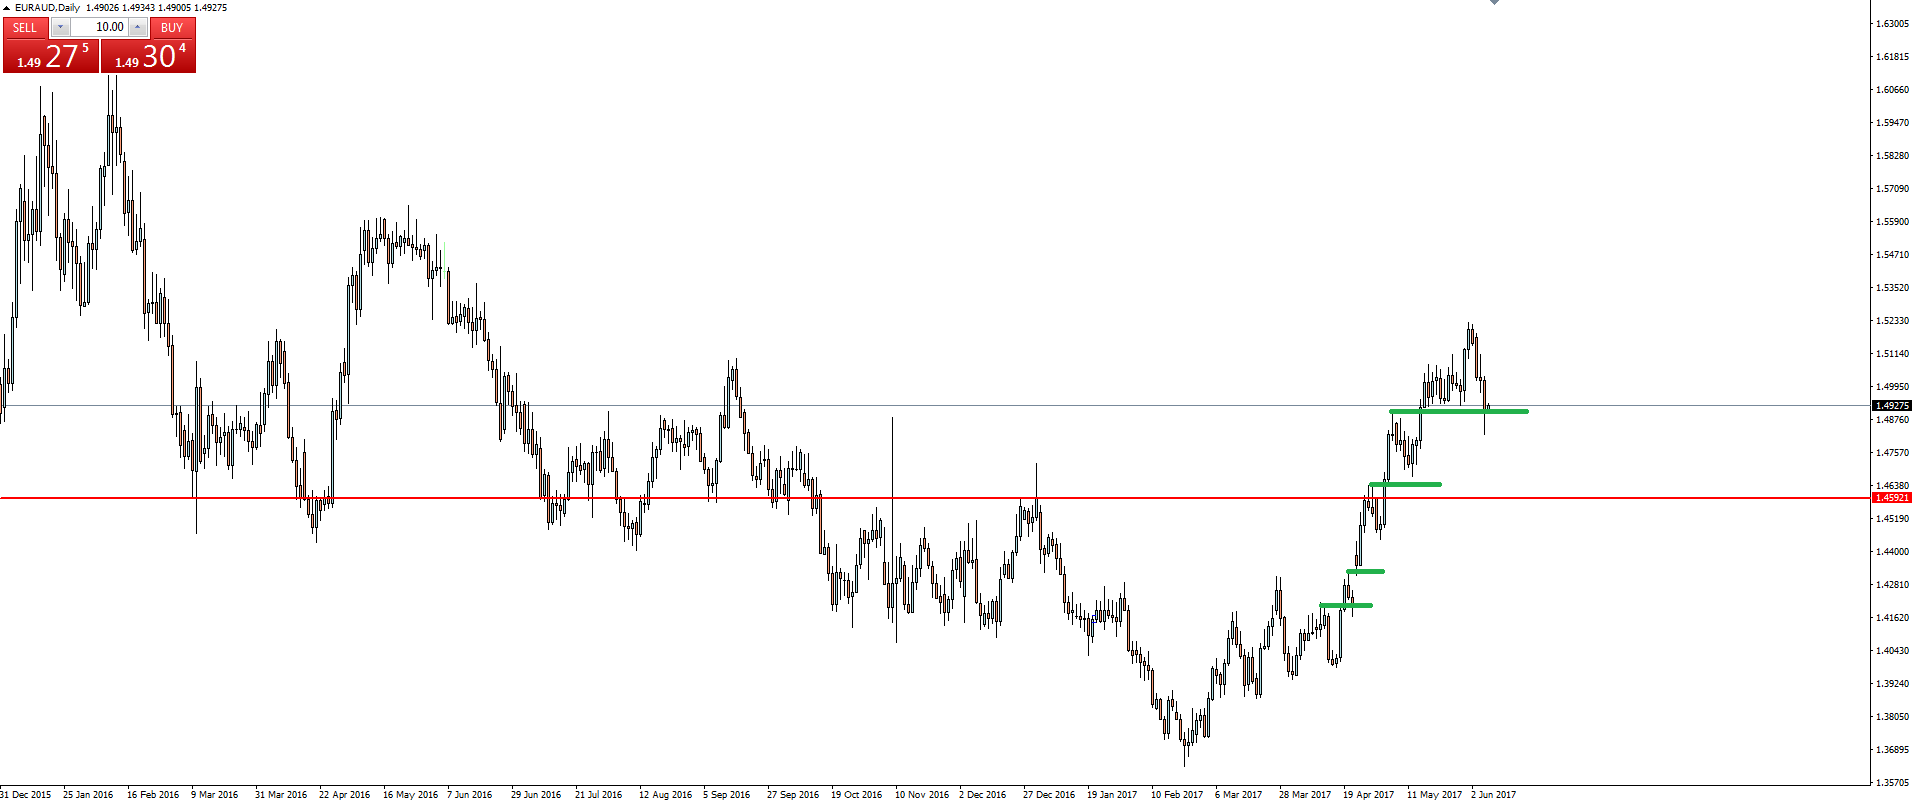
After the previous EUR/AUD resistance zone was broken and the trade no longer valid, I wanted to take a step back and just highlight the way that price has been acting.
On an obvious bullish tear, we’ve seen the following textbook perfect pattern:
“Break higher > Pullback > Retest previous resistance as support > Repeat”
Just look at the EUR/AUD daily chart and things are pretty self explanatory:
With the most recent pullback highlighted by Aussie dollar strength, the way that the daily candle wasn’t able to close below support shows just how bullish this pair is and keeps the pattern in tact.
Do you see price continuing on its merry way from here, or will Aussie strength cut the run short? Let us know by tweeting your setup to @VantageFX on Twitter.
Risk Disclosure: In addition to the website disclaimer below, the material on this page prepared by Vantage FX Pty Ltd does not contain a record of our prices or solicitation to trade. All opinions, news, research, tools, prices, forex signals or other information is provided as general market commentary and marketing communication – not as investment advice. Consequently, any person acting on it does so entirely at their own risk. The expert writers express their personal opinions and will not assume any responsibility whatsoever for the Forex account of the reader. We always aim for maximum accuracy and timeliness, and forex broker Vantage FX shall not be liable for any loss or damage, consequential or otherwise, which may arise from the use or reliance on this service and its content, inaccurate information or typos. No representation is being made that any results discussed within the report will be achieved, and past performance is not indicative of future performance.

