In the first quarter of 2015, it was suggested that the seasonal adjusting methodology understated economic growth in first quarters. Now in the second quarter of 2015, the scuttlebutt is that the inflation adjustment has overstated economic growth. My position is that the Bureau of Economic Analysis' annualized methodology for determining headline growth magnifies normally insignificant error - and that USA economic growth has really been in a tight range since the end of the Great Recession.
Follow up:
I have a history of bad mouthing GDP - mainly because I see most pundits misusing what it says. One would think that GDP has an direct relationship to Main Street as approximately 2/3rds of the comes from the consumers. But just because total consumption improves, we know the median consumer cannot be contributing much to this increase.
Indexed value of Median Household Income to GDP
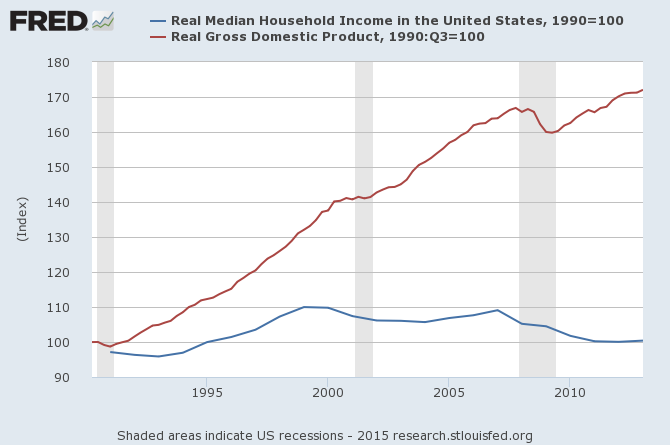
The USA economy is being driven by rich consumers - it is that simple. So when people think that rising water lifts all ships - this is not true in the case of GDP. Still GDP is a valid economic measure as long as one realizes that it is measuring only a certain cross-section of the economy. It does not measure stress or conditions on the poor, Joe and Jane Sixpack, or the average person who believes they are middle class. There are several other issues which make GDP irrelevant to the majority of the population - but that is for another post.
But the annualizing headline GDP is like riding on a roller coaster. It makes small changes between quarters into HUGE changes, it magnifies error, and most importantly - it presents the wrong conclusions on economic growth. This is a classical mountain-out-of-a-mole hill situation.
Headline Compounded Rate of Growth for GDP
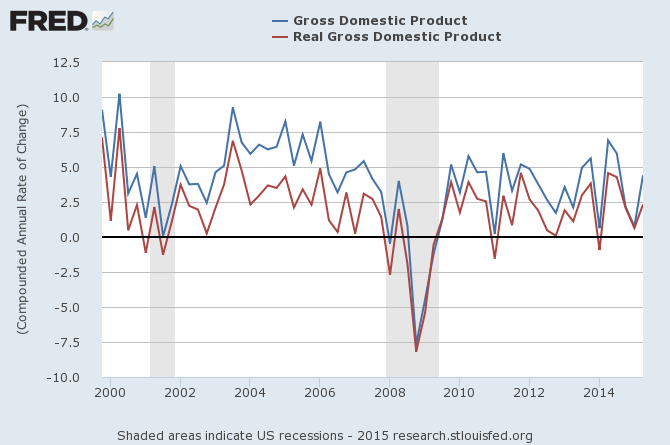
But when we start looking at GDP year-over-year growth, the rate of economic growth looks more realistic and much less noisy.
Year-over-Year GDP Growth
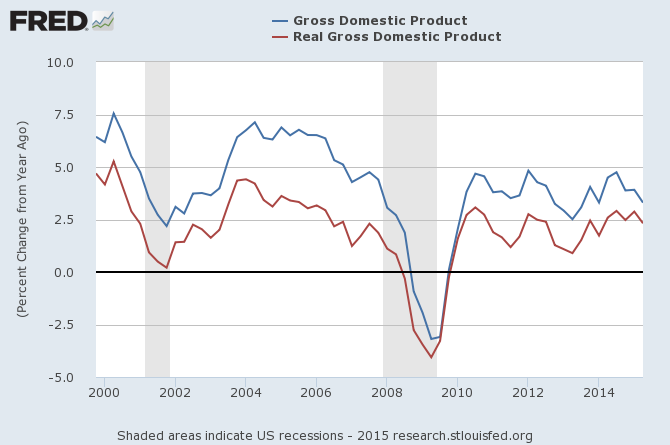
The blue line in the above graph is GDP without inflation adjustment (and the red line includes the "official" inflation adjustment). Either way we view GDP in year-over-year fashion, year-over-year growth declined from 1Q2015 to 2Q2015. Yet the headlines show economic growth was better in 2Q2015.
There is more than one way to look at data. There clearly is economic growth in the USA - even using very conservative methodology. However, I am not a believer that the economy varies as much as the headline GDP shows from quarter-to-quarter.
And they say that figures don't lie???
Other Economic News this Week:
The Econintersect Economic Index for August 2015 declined to the lowest level since April 2010. The tracked sectors of the economy remain relatively soft with most expanding at the lower end of the range seen since the end of the Great Recession. Our economic index has been in a long term decline since late 2014.
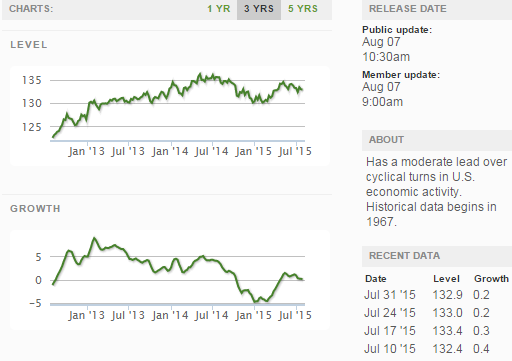
The ECRI WLI growth index is now in positive territory but still indicates the economy will have little growth 6 months from today.
Current ECRI WLI Growth Index
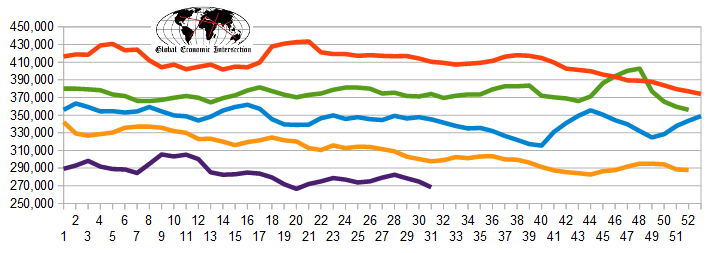
The market was expecting the weekly initial unemployment claims at 250,000 to 275,000 (consensus 273,000) vs the 270,000 reported. The more important (because of the volatility in the weekly reported claims and seasonality errors in adjusting the data) 4 week moving average moved from 274,750 (reported last week as 274,750) to 268,250. The rolling averages generally have been equal to or under 300,000 since August 2014.
Weekly Initial Unemployment Claims - 4 Week Average - Seasonally Adjusted - 2011 (red line), 2012 (green line), 2013 (blue line), 2014 (orange line), 2015 (violet line)
Bankruptcies this Week: Alpha Natural Resources, American Standard Energy
Click here to view the scorecard table below with active hyperlinks
Weekly Economic Release Scorecard:
