Earlier we talked about finding value with a bond issued by Transocean (RIG). This type of bond is a good relative value opportunity for investors who prefer a ‘buy and hold’ approach by way of owning the bond until maturity. This in essence locks in a yield of 3.03 percent per year when the bond reaches its maturity date in six years.
Having said this, there are other opportunities in the Investment Grade energy sector that can exceed the aforementioned annualized return without increasing its maturity date and thus adding interest rate risk. This can be accomplished if an investor uses a total return approach where both income from the coupon and price appreciation from the passage of time factor in the performance. While this approach is often used by fund managers and institutional players, it is a relatively easy strategy to implement. This strategy is often referred to as Rolling-Down the Yield Curve (For more information, please review Enhance Bond Returns by Rolling Down the Yield Curve).
The key to this strategy is identifying the steepest part of a yield curve of a single issuer which can be either a string of Treasuries or series of bonds from the same corporate issuer. Within the energy sector, EOG Resources (EOG) which is one of the largest independent oil and natural gas companies in the U.S. has multiple bond issuance and is a good starting point.
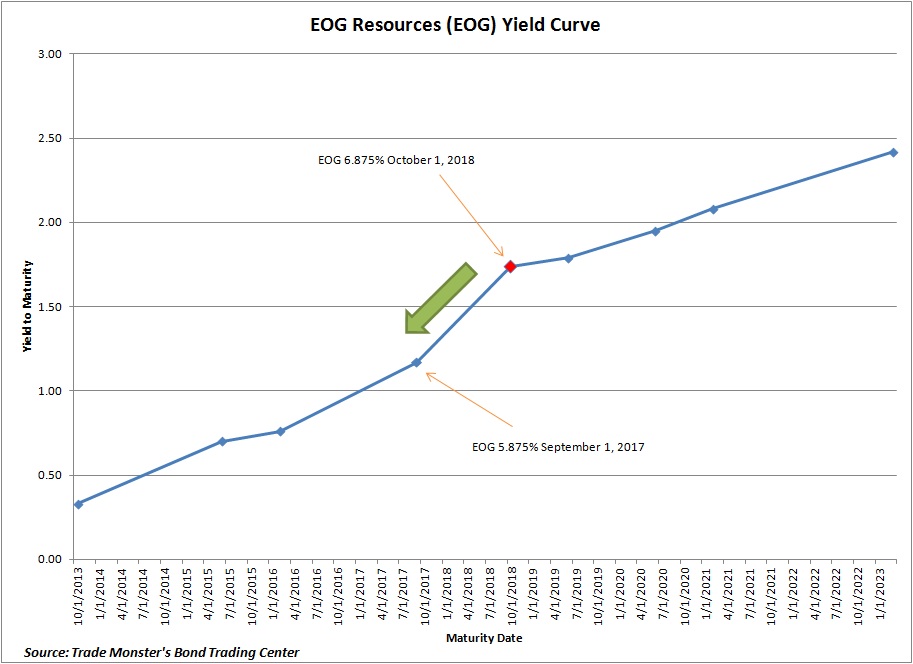
As you can see from the graphic above, the steepest part of the EOG yield curve which is highlighted in red is the six year part of the curve. The EOG 6-Year pays a semi-annual coupon of 6.875% and matures on October 01, 2018 (CUSIP 26875PAC5). The bond is a senior note and is a straight bullet maturity with no embedded early call feature. So the earliest an investor will get back its principal is at the maturity date, assuming no default. These senior notes are currently being offered at a dollar price of $128.47 which translates to a yield to maturity of 1.74%.
Now, savvy investors will know to not be deterred by this low yield since in order to realize this return, the bond will need to be held until it matures in 6 years. Since we are taking a total return approach with a shorter time horizon, the key to establishing our expected return is to come up with a projected price target and the amount of time that we plan on owning this 6 year bond. We can both determine this by knowing where the EOG 5-Year bond is trading today.
So why is the 5-Year bond important when we are focusing on the 6-Year bond that offers a higher yield?
The answer lies in the ultimate truth that our 6-Year bond will become a 5-Year in one year. The differential between the two maturities sets our time horizon.
Also, we know that markets are generally efficient where mispricing and inefficiencies are taken out by the plethora of market players. Like bonds from the same issuer should be close in yields. So we have confidence that the 6-Year bond in one year from now should trade close to levels of the current 5-Year, assuming “all else equal”. The yield of the longer maturity will migrate or “roll” toward the shorter one as time passes. So the yield of the 5-Year establishes the target price of the 6-Year bond that we are focusing on.
Going back to our example, we can see that EOG issued a bond that pays a 5.875% Coupon Maturing in September 01, 2017. This 5-Year bond is currently trading at a yield of 1.17%. So the yield on our 6-Year bond that is trading at 1.74% should fall toward that level in one year’s time assuming stable interest rates. Given these inputs, we use Bloomberg’s bond calculator to come up with the expected price and total return.
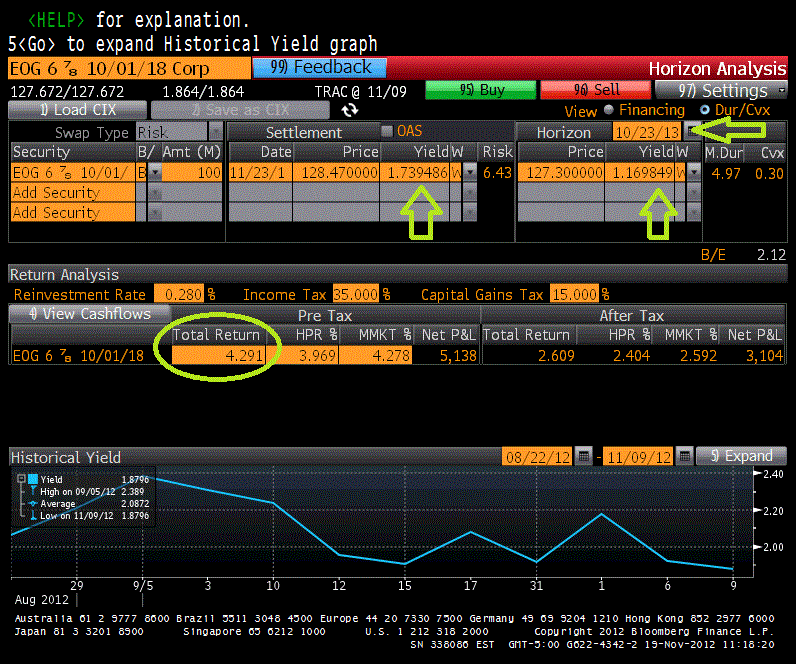
As you can see we purchased the EOG bond at a yield of 1.74% percent or a dollar price of $128.47. Assuming that rates are stable during our time horizon of less than a year or ending October 23, 2013, we plug in today’s 5-Year yield of 1.17%. This yield at this horizon date will correspond to a price of $127.30. This is the expected dollar price which we plan to monetize by selling in the open markets at our horizon date. While the expected dollar price is lower than our cost, the fact is that the high coupon earned over time provides a greater offset to a point where an investor profits. Given our reinvestment rate of 0.28% for coupon payments earned during that time period, this profit results in an annualized return of 4.29%. Once those gains are captured when the bond is sold at the horizon date at that expected price, the funds generated can be redeployed.
This strategy provides investors a return advantage over just a buy and hold approach. This is evident when you match up the horizon date with the maturity date of a bond from the same issuer. Currently, EOG 6.125% Coupon Maturing October 1, 2013 is currently trading at a yield of only 0.33%. So by using a 6-Year bond with a 1 year time horizon can produce a return greater than 396 basis points in the aforementioned scenario.
Keep in mind that the main assumption to this strategy is stable interest rates. As we all know, there is no such thing as a free lunch. As with any attempt to add returns, there are risks to this enhanced strategy. If rates rise, bond prices fall and this approach as described will not work. The good thing that investors can take comfort in is utilizing market transparency by the central bank of the U.S.
We know that in the September announcement, the Federal Reserve is committed to keeping interest rates low “at least through mid-2015.” Since our horizon date of October 2013 falls well within that time frame, it is reasonable to think that our main assumption of stable interest rates is fair.
But to be devil’s advocate where we challenge this even further, let’s assume the unlikely event that bond yields spike for whatever reason that undermines the Federal Reserve’s massive balance sheet expansion. In the case of this bond, this strategy falls apart. However, not all is lost if the main objective at that point is to avoid a losing trade. The key lies in extending your time horizon. In this scenario, this can be accomplished by just holding the bond longer and to maturity as principal should be paid back at par. So the return captured in our example should be the yield to maturity of 1.74%. So despite a massive shock in a rise in yields, the worst case scenario is a small but yet positive gain.
To summarize, below is a simple step-by-step approach on what we covered in the various interest rate environments.
Buy EOG 6.875% 10-1-2018 @ 1.74% Yield
- If interest rates are stable, bond should roll to from a yield of 1.74% to 1.17% on October 2013. Capture 4.29% annualized return in one year by selling bonds at horizon date.
- If interest rates fall before October 2013, sell bonds at optimal level as prices in general should appreciate.
- If interest rates rise, hold bond to maturity which should provide a return of 1.74% on an annualized basis over the next six years.
In terms of the fundamentals and credit, EOG Resources is one of the largest independent oil and natural gas companies in the U.S. This company which is headquartered in Houston, Texas has proved reserves around the globe ranging from United States, to the United Kingdom, and to China. EOG, together with its subsidiaries, explores, develops, produces and markets natural gas and crude oil.
EOG is a high quality company as evident by its credit rating that falls on the Investment Grade scale. This bond is rated A- by Standard & Poor’s and A3 by Moody’s, which are both three notches above the threshold between Investment Grade and High Yield.
In addition, EOG has been profitable and their debt exposure is relatively small. As of the 3rd quarter of 2012, EOG has produced $5.9 billion in EBITDA (which is Earnings Before Interest Taxes Depreciation and Amortization and is one measure of profitability) over the past 12 months. Compared to Net Debt (Debt Amount less their Cash Holdings) of $5.2 billion which translates to a Net Debt to EBITDA ratio of 0.9x, EOG has little overall leverage. In other words, it would take less than a year of profitability for EOG to pay off all of its outstanding debt.
In addition, EOG earns enough to cover its interest expense from the debt it owes. Over the past 12 months, EOG paid a total of $211 million in interest expense. Given the $5.9 billion in EBITDA, EOG has more than enough earnings to service its debt, close to 28x the amount. This ratio is referred to as the Interest Coverage ratio which shows how easily a company can pay interest expense given their profitability. A higher Interest Coverage Ratio implies better credit health since it is making enough money to stay current with their debt interest obligations. Conversely, a red flag is raised when this ratio approaches 1.5 or lower since its ability to pay the interest on their debt is questionable. Given its Interest Coverage of close to 28x, EOG has plenty of cushion.
Going back to the bonds, keep in mind that corporate bonds trade over-the-counter. So, prices and yields can vary depending on the broker you use. The best suggestion is to use a broker that offers the most visibility and price transparency for the corporate bond market. This can be achieved by comparing the price to buy and the sale price (aka bid-ask spread). The closer the differential usually means the better the liquidity.
Information and market quotes on the bond investments are provided by Trade Monster’s Bond Trading Center.
As always, every bond investor should perform their own due diligence when making their investment decisions.
Disclaimer: The above content is provided for educational and informational purposes only, does not constitute a recommendation to enter in any securities transactions or to engage in any of the investment strategies presented in such content, and does not represent the opinions of Bondsquawk or its employees.
