Investing.com’s stocks of the week
A quick look at long rates and the Dollar, before proceeding to the precious metals:
LONG BONDS (ARCA:TLT)
The 1-year TLT chart (Barclays 20+ year Treasury Bond Fund) below has recently been even stronger than what I had thought it would be in the shorter term.
I reiterate that falling rates is precious metals-positive, but more on that in the precious metals section below.
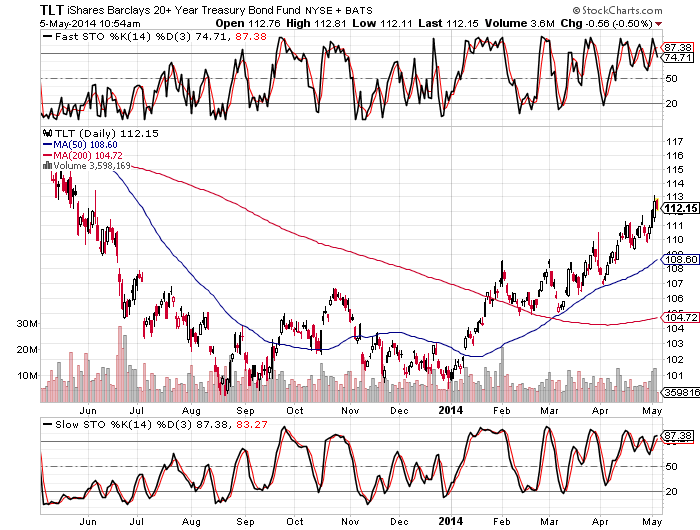
A key takeaway that I wish to offer readers is that, after identifying multiple turns, I have been watching bonds be "too" strong.
Simply, the multiple bearish slow stochastic divergences (under 1-year price chart) warn of a quick smash to the 109 area, when we further consider the ascending wedge pattern that has developed since the end of March.
Sure enough, that is when we saw our 1st divergence; note that it was followed by a quick ~$3.50 smash.
Today, we see 2 divergences, not 1, along with a wedge that is sneaking up into its right-hand corner.
Expect another $3.50 crack. (*See gold comment.)
DOLLAR
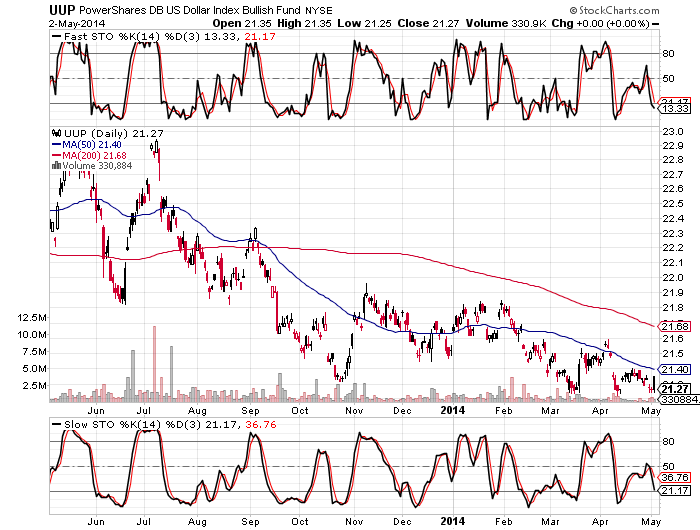
The 1-year PowerShares db USD Index Bullish (UUP) (PowerShares DB US Dollar Index Bullish Fund) chart appears immediately below.
April 1, 2014
"As previously analyzed, the USD is within a broad expanding triangle.
"Points-1, 2, 3 and 4 completed in the May through July period of last year. Point-5 then concluded in October 2013, while point-6 concluded at the end of this past January.
"The upshot is a swift and deep decline because, by definition, that is what point-7 must necessarily be in an expanding triangle. With a slow stochastic that is rolling over from a very lofty height, one must be on guard for a swift smash anytime."
Over the past month, the Dollar did indeed suffered a short and hard smashette, while the trends of both the price and slow stochastic are entirely consistent with the unfolding point-7 collapse to which I have again referred in the excerpt above.
PRECIOUS METALS
The 1-year SPDR Gold Trust (ARCA:GLD) chart appears immediately below.
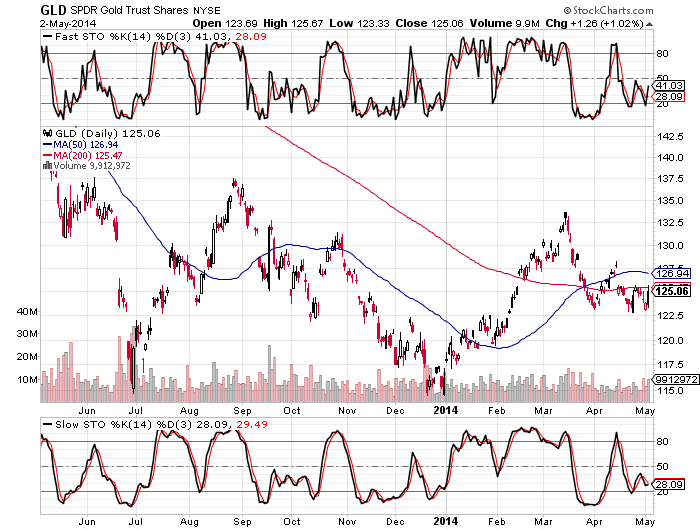
The neckline support and key retracement level discussed last month did hold, though bulls are far from happy as yet.
Lower rates are bullish for the precious metals (as discussed in the TLT section above) but, for now, the safe haven money has been flowing into bonds.
This explains why bonds went up on those days when "good economic news" would have ordinarily had an opposite effect on other occasions.
Not only does the crowd doubt the goodness of the news propaganda, but it is scared about what is brewing in the Ukraine.
*So why would gold not rally instead? Because the crowd wants liquidity. And that's also why a quick and dirty smash in bonds could coincide with a partially counterintuitive rally in the precious metals.
NB: I very much wish to draw attention to the similarity in the massive TLT and GLD reverse shoulder-head-shoulder patterns! If the bonds are leading, which is totally logical, gold will erupt ~$150 with speed.
Such speed is consistent with the Wave-3 eruptions in the precious metals that I discussed and forecast last month. Of course, silver's new short term low did not appear so consistent for that metal's bulls.
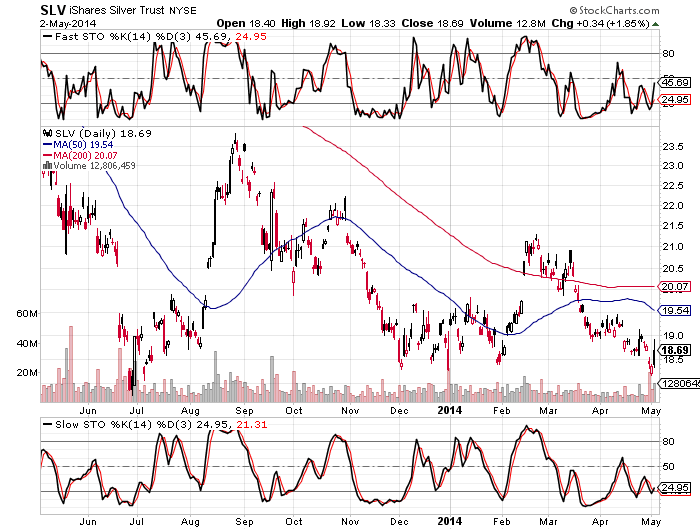
However, on closer examination, please note that silver's slow stochastic has now put in a bullish double divergence. (1-Year iShares Silver Trust (ARCA:SLV) chart appears below; slow stochastic is seen under the price chart.)
The June 30 2013 low was silver's left shoulder, while the head occurred at the end of the year.
By having a right shoulder break under the reverse-head, but hold above the left shoulder has created the psychological stage for a sentiment shocker if the SLV were to spike up over $21 now.
The market could then be stunned to see how viciously the bulls could break the bears' backs with a spike to over $24.
Consider copper:
April 1, 2014
"Copper has been the noose around silver's neck of late, reigning it in when gold was providing precious impetus. Regarding the technical association, the good news is that, "historically, copper has bottomed after silver, which, again, has reason to be attracted upward by gold.
"The bad news is that copper's momentum indicators are now lined up in a manner that is consistent with another reversal of fortune.
"This would be consistent with another short term bearish interpretation for silver. Namely, the all-powerful 6-month cycle next bottoms at the end of June and that could line up closer to when copper may more likely have troughed."
The 1-year iPath DJ-UBS Copper Subindex TR (JJC) (iPath Dow Jones UBS Copper Subindex Total Return ETN) chart follows.
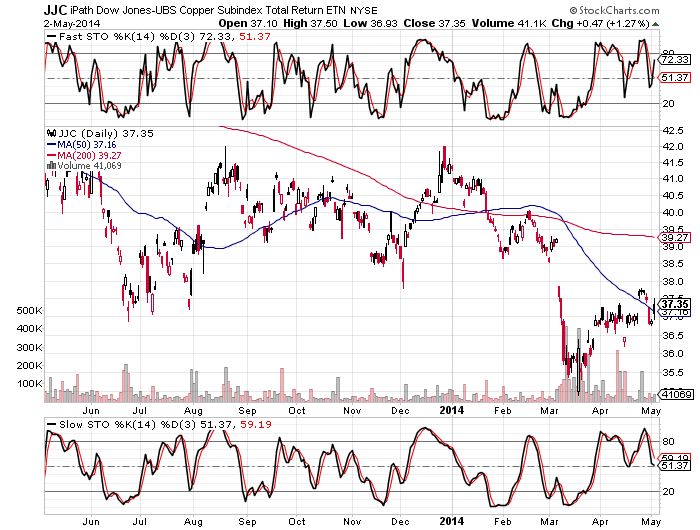
Despite the strength in gold, copper's strong rally has left silver to make new lows, in a most counterintuitive fashion.
Copper had been the noose around silvers' neck, reflecting back to gold's baby brother its feature as an industrial metal.
Silver's short term stops were ravaged last week as bulls looked on helplessly, watching this manipulated market ignore the relative strength in gold (the precious) andcopper (the industrial).
However, as a history major and colleague once taught me long ago, the longer something is manipulated, the more violent will have been the opposite reaction when it comes.
And that day is coming. And boy is it going to be violent.
Yes, as per the copper analysis above, the 6-month cycle low in silver (June 30) will mark the more important bottom.
However, while it would appear that such a low may be a higher one within an uptrend, it could be even better. (Understandably, given the recent level in silver, there are those who fear new year lows altogether; I am not one of them.)
Though sharp spikes higher do not ordinarily occur at the end of a cycle low (only 2 out of 6 months remain), this is not an "ordinary" market. A run can occur at any time.
Whatever the market does, it's just getting the younger guys to run, leaving them with little more analysis to offer than multiple scenarios and few worthwhile corresponding strategies.
I reiterate the recent strategic approach of using 2016 calls.
No stops are needed, as dramatically cheap prices in both the underlying security, as well as the historic premium levels obviate the need to have many strategic concerns swimming in one's head.
CONCLUSION AND STRATEGY
If one feels to only be 50% long the above mentioned calls until after the June 30 cycle low, that is a fine strategy.
However, at these prices and under these circumstances, in the aggregate, one would be nuts to not at least be 50% long.
April 1, 2014
"Also a major factor for PM traders is the historically inverse correlation with the Dollar. The Dollar can go into a point-7 smash at any time, which would be consistent, and could coincide with a Wave-3 advance in the metals.
