Let me preface this month’s commentary with a few personal beliefs.
• I believe in behavioral economics. While we are generally rational beings many decisions
(financial and otherwise) are made based on personal bias, emotion, fear of loss, availability,
and NOT strict logic. This can lead to mis-pricings/market inefficiencies.
• This reality (and other incentives – like payment for order flow, data speed, computing power)
gave rise to a rapid expansion in purely quantitative trading.
• When trying to discern why or how something works the way it does, especially where money
is concerned, I believe it best to look at INCENTIVES first. We are (highly evolved) animals –
which means we are susceptible to making consistently poor decisions if there is a great enough
incentive to do so. (Drug abuse, assuming $150k in debt to “study” Art History @ Tufts, etc.)
• I believe that there is a significant and growing disconnect between the US Equity markets and
the Economic reality that is supposed to support future earnings.
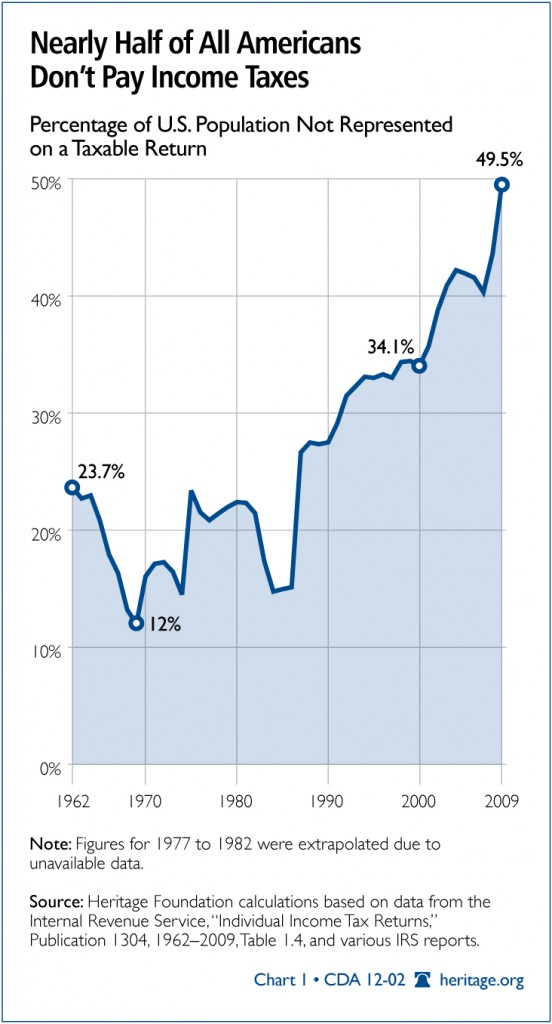
There has been much talk over the past year, and again of late about the “takers” and parasitic
dependency issues. We are a year removed from the last election, but you will likely recall the stir
caused by Mitt Romney’s comments about the “47%”. He was alluding to the percentage of the US
population that pays no Federal Income tax. Depending on the data you use – he was correct and may
have under estimated the percentage of the population that doesn’t pay Federal Income Taxes. That
type of information serves as red meat for political bases and the 24 hour news cycle, but how much
does it actually tell us?
Like most things, the devil is in the details. Political operatives are not incentivized to focus on nuance.
They are paid to motivate their team and get out the vote.
Mark Twain made famous the saying: “Lies, damned lies, and statistics” – essentially the ability to
bolster potentially flimsy arguments with numbers. It happens all the time.
I am not making a political argument; I’m just using a handful political/economic examples to hopefully
make a few salient points. Personally, I’m repulsed by both parties and insulted by an ingrained “Two- Party System”. I have more choices for milk in my refrigerator right now than viable political alternatives
when I go to the polls(no offense to Libertarians, Greens, etc.).
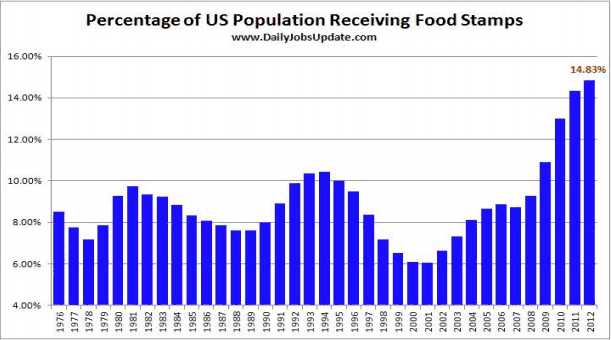
More recently, much ink was spilled about the cutback in Supplemental Nutrition Assistance Program
(SNAP – food stamps) for the 47 million recipients nationwide. Again, I’m not looking for a political
squabble – I want to do some math.
• SNAP recipients = 47 million. (http://www.fns.usda.gov/pd/
• US Population = 314 million (http://www.census.gov/
• 47/314 = 0.1497.
15% of the US population now participate in the SNAP program.
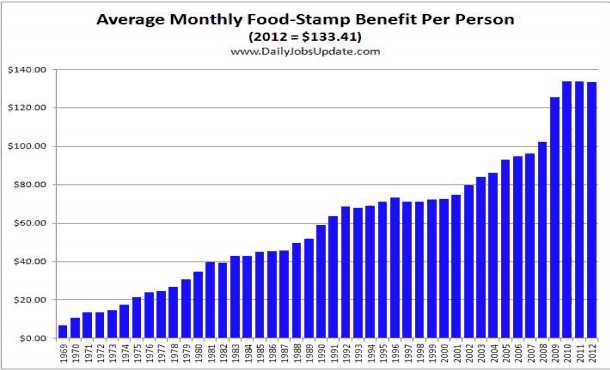
Here’s a look at the average monthly “benefit”. Clearly it’s increasing, but generally it’s just adjusted for
inflation. “Stuff” costs more than it did in 1975.
• 1975 Social Security benefits for a qualified individual = $157.70/month
• 2013 Social Security benefits for a qualified individual = $710.00/month
• Increased by 350% over the past 38 years. (http://www.ssa.gov/oact/cola/
• 1975 SNAP benefit = $21.50/month.
• 2013 SNAP benefit = $133.41/month.
• Increased by 520% over the past 38 years.
In order to qualify for the SNAP program an individual must gross less than 130% of the poverty line
income. The cutoff for a one person household =$1,245/month. (Net income of $958).
(http://www.fns.usda.gov/snap/
Is their abuse of the SNAP program? ABSOLUTELY. There is abuse of EVERY government program, but do you envy someone that grosses less than $15,000 annually?
The total cost of the SNAP program in 2012 was about $75 billion.
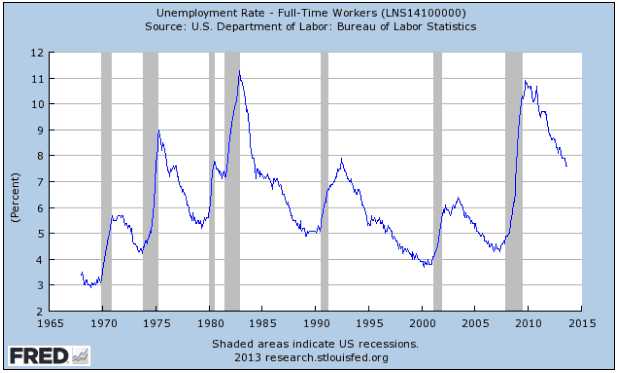
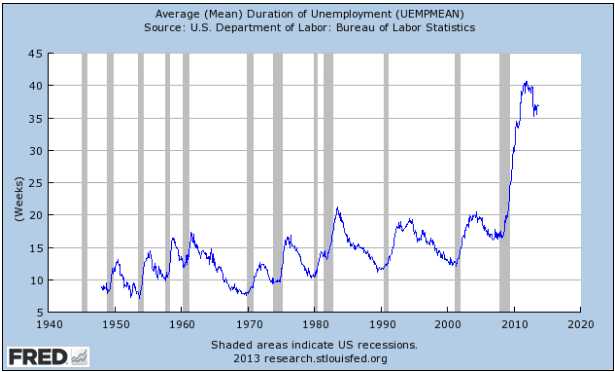
Unemployment naturally ebbs and flows with economic growth/contraction. The inverse correlation is
clearly visible here:
Unemployment moves higher during recessions (shaded areas) and tends to abate during periods
of economic expansion. No Ivy League MBA is required to understand that relationship. However,
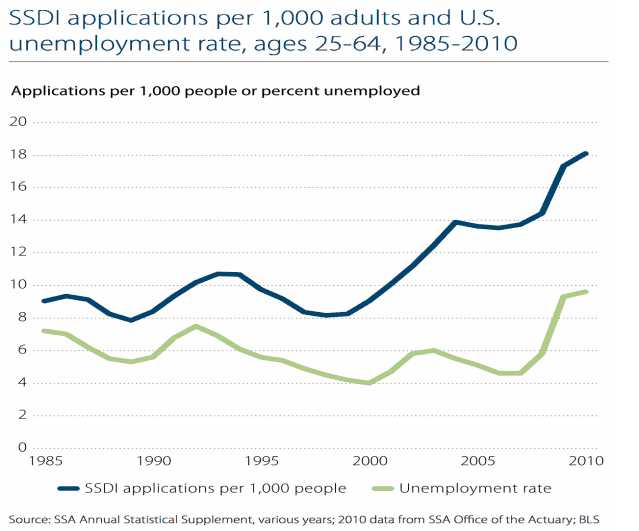
something unique happened following the return to “growth” in 2009 – long term unemployment
(structural) exploded along with Disability Applications/rolls.
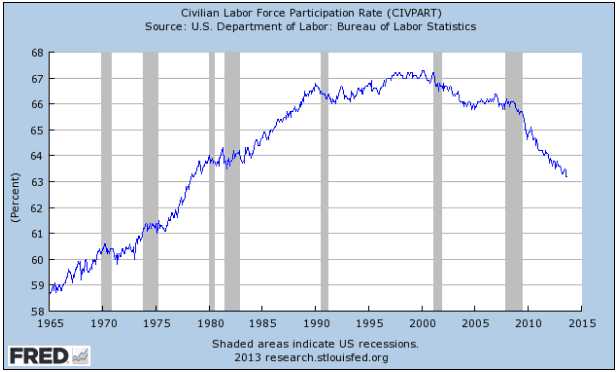
Labor Force Participation Rate:
Essentially the unemployment rate is falling because people have stopped looking for work. This is not
cyclical, it’s almost certainly structural.
Example: Male head of household is downsized in early 2009. For the first 26 weeks (1/2 year) he
collects unemployment from the state he worked in, after which (assuming no new job) he moves onto
the Federal Unemployment rolls for the next 73 weeks (1 year and 5 months). He must show that he
is seeking employment, and will receive Unemployment Insurance benefits for just shy of 2 years. He
is counted as part of the labor force the entire time. After the two year many give up the search for
unemployment. Having exhausted 99 weeks of unemployment and going 4 weeks without looking for
work = falling out of the Labor Force.
90,609.000 Men and Women have fallen OUT of the Labor Force. Almost 91 MILLION PEOPLE. There are a handful of reasons for this decline which include outsourcing, increased dependence on part time work, a growing number of Baby Boomers retiring and fewer new workers being hired on, a greater
number of women are leaving the workforce than prior to Great Recession. Whatever the reason….it’s
concerning.
Many, however, move from Unemployment to Disability rolls. Nearly 9 million Americans are currently
disability benefits. That number has doubled since the mid 90s.
More math time. (http://www.census.gov/prod/
• US Population = 314 million
• Working Age US population = 242 million
• 140 million actually working
• 90 million NOT participating in Labor Force
• 11.3 million on unemployment
• 47 million Food Stamp recipients
• 9 million on Disability
• 41 million over 65 years of age
• 75 million under 18 years of age.
http://www.bls.gov/news.
The is almost certainly some overlap between the 90 million that have fallen out of the Labor Force or
the 11+ million on unemployment and those receiving SNAP benefits. Nevertheless, the math does not
seem sustainable at the current pace. Between Social Security, Medicare, Disability, SNAP, etc and 1.5 –
2.5% annual GDP growth – something doesn’t add up.
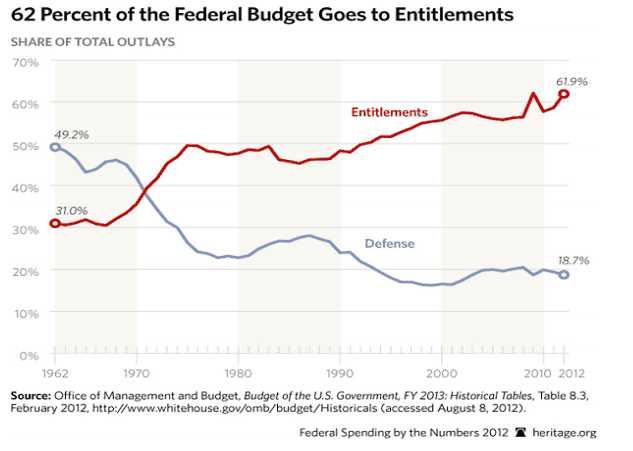
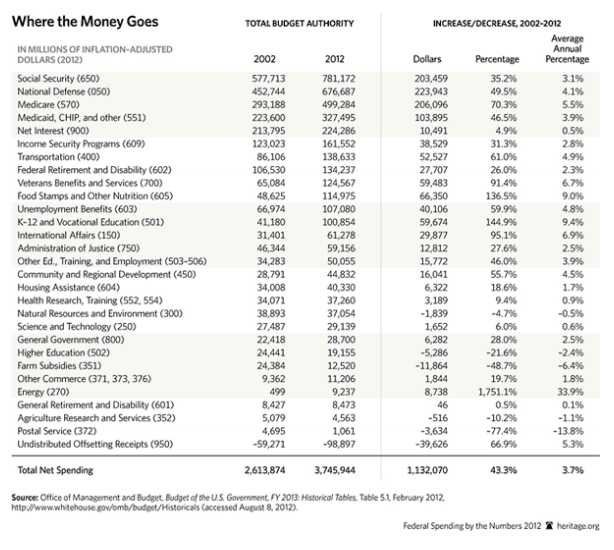
GDP v. Where the Money Goes (entitlements and defense):
• US GDP = $15.7 Trillion
• Social Security payments = $780 billion
• National Defense = $677 billion
• Medicare = $499 billion
• Medicaid = $327 billion
• Interest on the Debt = $224 billion
• Unemployment = $162 billion
Supplemental Nutrition for Asset Prices (SNAP II)
Politics is, in my estimation, is about the allocation of (scarce?) resources. Politics in everyday life
is about power, and power has a tendency to corrupt. Now, before I turn this into a dissertation,
we covered how roughly half of the US population is receiving some sort of transfer benefit from
the government. In other words, a lot of people at the low end of the income scale are getting help
from the state. Those on the other end of the income scale have benefited tremendously from very
accommodative monetary policy and Quantitative Easing/stimulus which has lifted asset prices across
the board.
Wealthy people tend to have assets (property) and investments and one could argue that Quantitative
Easing is like Supplemental Nutrition for Asset Prices (SNAP II?).
The (magical) thinking has its roots in the Great Depression and goes as follows – Deflation is the
greatest threat to the system and must be avoided at all cost (Bernanke and Yellen are acolytes of this
Keynesian school of thought). See also: The Paradox of Thrift.
The Bretton Woods conference gave birth to the International Monetary Fund (IMF), US Dollar
hegemony (the Pound Sterling was antecedent), and fixed exchange rates with the USD linked to Gold @
$35:1ounce. This worked until it didn’t and in 1971 we came off the Gold standard and “capital” became
increasingly less scarce in a fiat world.
The “wealth effect” inextricably connects perceived wealth with future spending/consumption.
Behavioral economics is back at work. This is Psychology intersecting with the Dismal Science. We feel
wealthier (and likely increase spending consumption) when our biggest asset (home) is increasing in
value and/or our retirement/investment account(s) are growing.
The Federal Reserve continues to funnel $85 billion per month into the system in an effort to keep
interest rates low and incentivize consumption. That works out to just over $1 TRILLION dollars a year.
QE1, QE2, Operation Twist, and QE3/Infinity have supported asset prices over the past 5 years. The Fed
hopes that their support (read: our tax dollars) will also propel the larger economy into escape velocity
but data has yet to confirm organic growth (FIVE FULL YEARS after the acute stage of the crisis).
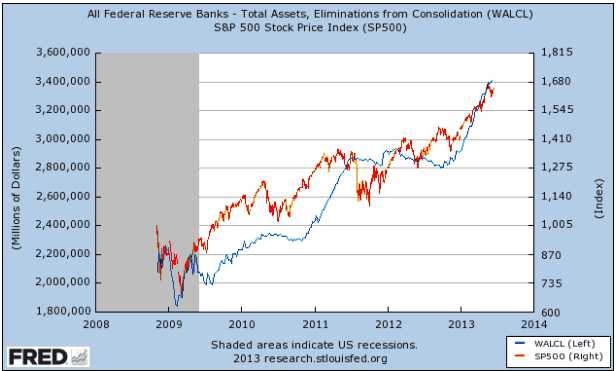
I believe there is a DIRECT CORRELATION between QE and Asset Prices (S&P/RUT performance as well as Housing). The Blue Line represents the Fed’s Balance Sheet and the Red Line represents the S&P 500.
When the Fed halted purchases in 2010 – Equities suffered and a similar scenario transpired in 2011
when the Fed went on hold.
On May 22, 2013 in testimony before Congress, Bernanke hinted that they could begin the “Tapering”
process before the end of the year. Equities almost immediately went into a tailspin and borrow rates
spiked with an alarming velocity. Market participants had expected a gradual withdrawal starting at the
September FOMC meeting but that did not happen. Now the talking heads on CNBC point to March of
2014 for the training wheels to start coming off. At some point I believe the Fed will have to remove the
monetary methamphetamine or run the increasing risk of old fashioned inflation. I don’t believe you can
have your cake and eat it too forever, but then again we have an obesity epidemic too, so perhaps you
can.
From a business standpoint, we look to work with clients that have benefited from QE. RCM’s clients
have property, they have hard assets, they have paper assets, and they look to protect and grow their
wealth. There are a variety of ways we endeavor to help our clients. As we move closer to the point of
“Tapering” I have recommended that those with considerable passive long Index (S&P, RUT, Wilshire/
Global or Emerging Market) exposure consider HEDGING a significant portion of their risk.
I would also recommend considering a strategy to insulate yourself against the potential for higher
interest rates. I work closely with Jim Daehler who runs a Commodity Trading Advisory with this specific,
strategic focus.
Tapering began for one costly government program last week (SNAP = $75 billion annually) and one day
it will begin Tapering another costly program (QE Infinity = $1 Trillion annually). You likely pay insurance
premiums on your other valuable assets (home/property) – why wouldn’t you do the same with your
paper portfolio?
Feel free to call/email for more information about hedging macro portfolio risk or to learn more about the Infinity Advisors Treasury Trading Program.
