It feels like we have almost packed a full year’s worth of stock market price action into just the last two weeks. With so many diverging market sectors and overall fluctuations, I thought it would be prudent to do an examination of some key charts.
Taking a closer look at these categories can help frame macro views as well as determine areas of strength and weakness.
1. SPDR Dow Jones Industrial Average ETF (NYSE:DIA)
Perhaps the most surprising area of strength has been the rocket ship that is the Dow Jones Industrial Average. The Dow is often easily overlooked for its concentrated mix of just 30 mega-cap stocks. However, this index (as represented by the exchange-traded fund DIA) has now blasted off to all-time highs on the back of the Trump victory into the White House.
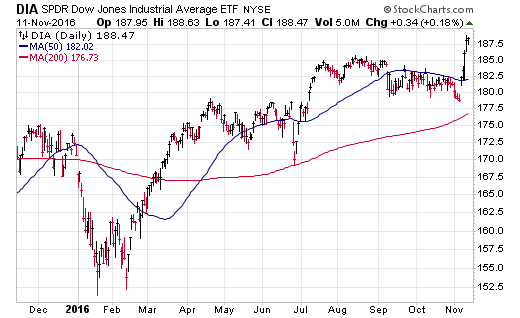
It’s worth pointing out that there was a technical breakdown of the trend channel near the start of the month that ultimately proved to be a fake out. DIA is now up over 10% so far this year and leads all major domestic stock indices except for small caps.
2. iShares Russell 2000 ETF (NYSE:IWM)
Speaking of small cap stocks, the Russell 2000 Index has finally made it back into all-time high territory. IWM has been proclaimed one of the strongest areas of momentum since the February 2016 lows and continues to show diverging strength from its large-cap peers.
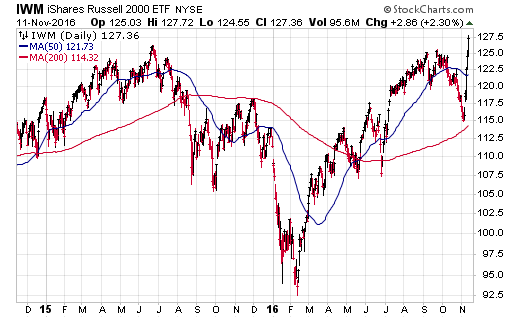
Leadership in the small cap category is often cited as a convincing sign of strength for the bulls. Although, a move of 10%+ in such a short period may call for a bit of hesitation with respect to putting new money to work here. I would rather investors who have missed this rally wait for a pullback before they decide to commit fresh capital.
It can be enticing to try and chase recent performance, especially in an area that looks red hot. However, those feelings of enthusiasm can quickly turn to regret if you commit the cardinal sin of buying near an inflection point. IWM is now up more than 14% so far this year.
3. SPDR S&P Bank ETF (NYSE:KBE)
The banks! There has been a great deal of commotion surrounding the financial services industry in 2016. Scandals have plagued Wells Fargo (NYSE:WFC), European banks have fought disparate circumstances, and regulatory woes are an ever-present outcropping. Nevertheless, investors seemed heartened for this industry after the Trump win, which sent KBE soaring.
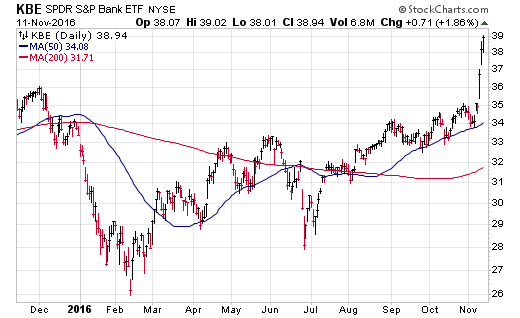
Many chartists have pointed out that the banks are slowly returning to share prices not seen since the 2008 financial crisis. That boost of confidence is attractive in the near-term. However, this is another area that should be viewed with caution for new money after a big rip higher. Chasing a knee-jerk reaction can be a dangerous circumstance without proper framing for risk.
4. CBOE 10-Year Treasury Note Yield (TNX)
One of the major catalysts for strength in financial stocks is the rip higher in Treasury bond yields. The 10-Year Treasury Bond has now retraced nearly its entire move for the year and now sits just above 2.1%. This trend of rising rates started four months ago when fixed-income became over-loved and over-bought.
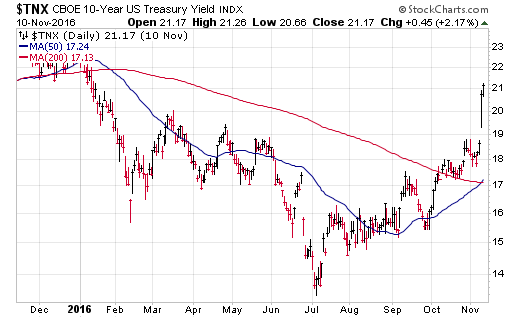
This move has been magnified by the results of the election and the possibilities of additional rate hikes by the Federal Reserve. Consider that this index is now more than 50% off its lows and you can start to get a feel for how far it has come in such a short period.
5. Interest Sensitive Asset Classes
It’s not just bonds that have been affected by this trend either. Interest-rate sensitive asset classes like utility stocks (via Utilities Select Sector SPDR (NYSE:XLU)), REITs (via Vanguard REIT (NYSE:VNQ)), and preferred stocks (via iShares US Preferred Stock (NYSE:PFF)) have seen their prices decline significantly off the highs as well. The chart below illustrates those trends by their ETF equivalents.
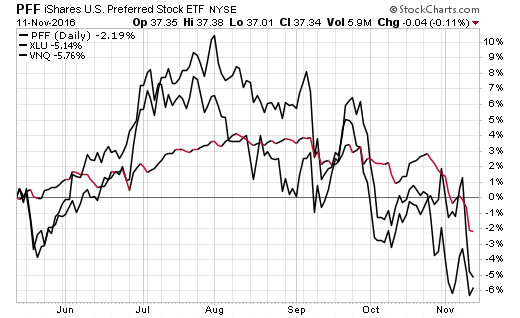
Many of these sectors are also highly represented in low volatility stock indices, which have significantly underperformed the broad market over the last several weeks.
6. iShares MSCI EAFE ETF (NYSE:EFA)
International stocks have truly been a mixed bag. EAFE represents a broad swath of emerging and developed nations. Latin America and other emerging countries have been selling off dramatically, while Europe has mostly held it together. This dichotomous relationship has created some churning action in broad-based international funds like EFA.
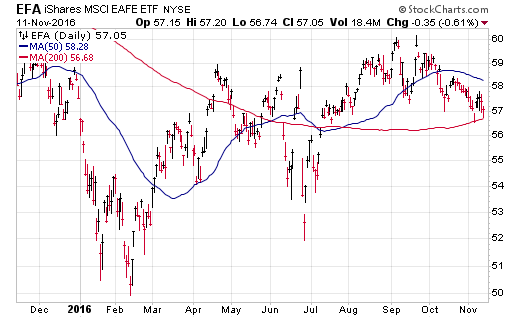
International stocks are mostly flat on a year-to-date basis and will likely experience continued volatility in the near-term. The impact of currency fluctuations and other factors will contribute to a tug-of-war effect within many of these diversified funds. Nevertheless, it’s worth pointing out that on a relative basis these stocks are considered undervalued versus their U.S. peers.
7. PowerShares DB Commodity Index Tracking Fund (NYSE:DBC)
Commodities certainly experienced a bit of selling this month as well. The initial expectation was that precious metals would do well under a new administration. However, the surge in risk assets led to a sell-off in gold and silver. A similar effect was achieved in the energy markets as well. Thus, broad-based commodity baskets like DBC have declined from their highs and may test the recent August lows.
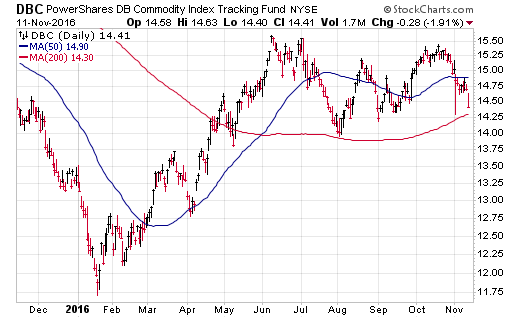
Commodities have been a difficult area of the market for trend followers to get behind. Although there does seem to be a burgeoning belief in the return of inflation under a Trump presidency. Only time will tell how that plays out.
The Bottom Line
So much has taken place in such a short period in the financial markets. However, I would caution against making significant portfolio changes in the midst of so much anxiety. Often the first reaction is to try and capitalize on “new” momentum or quickly try to insulate your portfolio from certain risks.
It seems too early to speculate that the shock waves will continue indefinitely. Even if you have been caught off-sides by this event, it would behoove you to take a calm and measured approach to any asset allocation shifts. The risks may quickly outweigh the benefits if you try to time every little reaction in the market without weighing both sides.
Disclosure : FMD Capital Management, its executives, and/or its clients June hold positions in the ETFs, mutual funds or any investment asset mentioned in this article. The commentary does not constitute individualized investment advice. The opinions offered herein are not personalized recommendations to buy, sell or hold securities.
