Starbucks Corporation (NASDAQ: NASDAQ:SBUX) began the new year slightly below its long-term plan as revenue only improved by 7% and earnings per share rose 11%. The company continues to target earnings growth of between 15% and 20% each year through 2021 with its aggressive expansion plan, which aims to add 12,000 new locations over the next five years to boost its store base by 50%. Consequently , investors shouldn’t panic to the short term macro-related weakness and focus on the bigger picture of the coffee giant .
Starbucks Daily Chart Technical Analysis
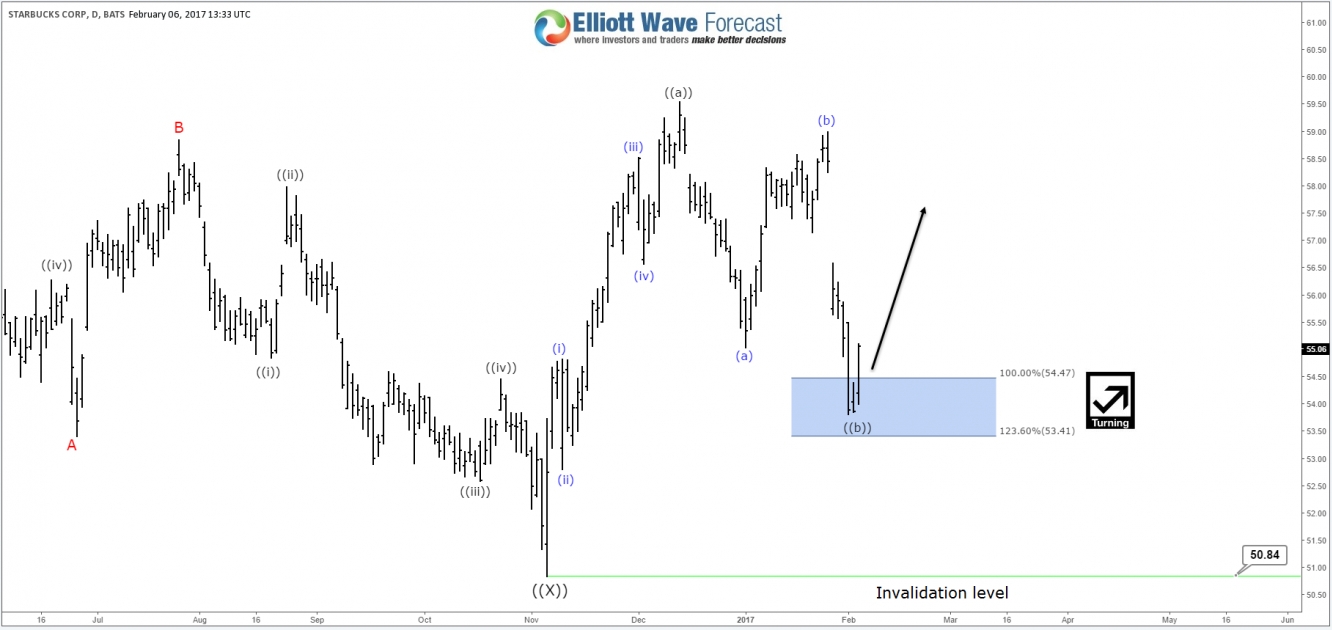
The stock did 5 waves from November low $50.84 and currently ended a 3 waves correction after it reached equal legs area $54.47 – $53.41 , so now the stock will either resume the move higher from current levels or just bounce in 3 waves against the previous peak ( 12/13/2016 ) before doing a double correction lower .
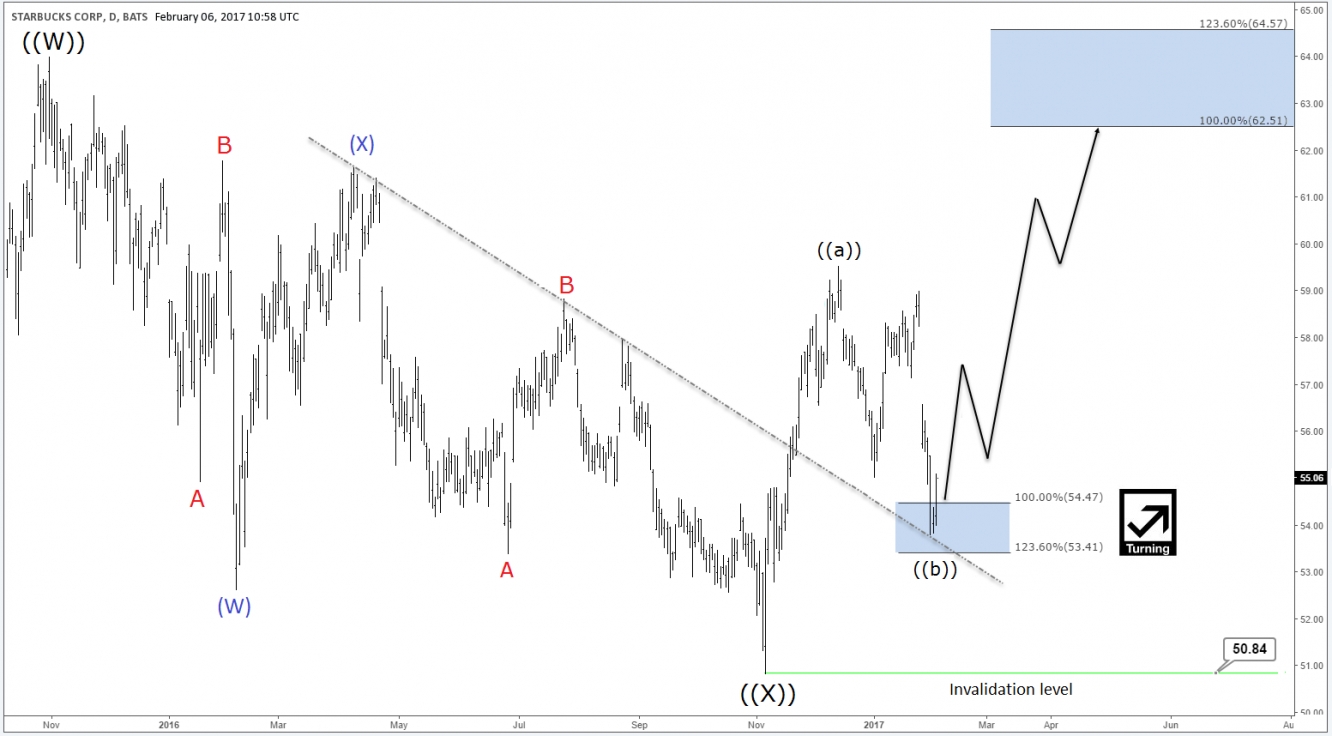
Let’s zoom out of the daily chart to have a better perspective , SBUX ended Double Three correction (7 swings structure) from 2015 peak so consequently the stock should either resume the main trend which is bullish or just do a 3 waves bounce which already started with the first leg from November low . The target area for Starbucks if it rallies from current levels to do a similar move to previous cycle would take it toward equal legs area $62.51 – $64.57 to end a Zigzag structure (abc) . However the move can extend toward the 161.8 Fibonacci extension area and become the 3rd wave of a larger 5 waves impulsive move which means the stock will break above 2015 peak and make new all time highs .
Recap
The technical analysis for Starbucks using Elliott Wave Theory is supporting a bullish move to the upside and we need further data to determine if it’s going to break to new highs or just retest the previous peak and fail lower . Either way a short term 3 waves bounce is expected as long as last week low stays intact and the pivot at $50.84 low remain in place .
