There is truth in the old adage that many cannot see the forest for the trees. I have seen financiers and engineers faced with a problem, pull out a calculator, and puke out analysis with solutions missing the big picture.
Follow up:
In some ways - Bosch, Audi (OTC:VLKAY), Porsche (OTC:VLKAY) and VW (OTC:VLKAY) are faced with the results of this dilemma with their diesel engine emissions. Did they consider what actions could be taken if their little subterfuge with gaming emissions testing was discovered (not to mention these corporations were working against public good which is nasty).
Engineering is constantly faced with dilemmas. Too stiff, it breaks. Too soft, it bends. Governing factors rotate as conditions change. The governing factors many times have solutions which cause failure when other governing factors dominate. Sometimes solutions become so complex that they violate KISS (keep it simple stupid), But when you cheat on a complex solution and are caught, you are up sh@t creek because usually no implementable alternate solution exists.
The Federal Reserve and other "economic" wizards believe the low employment participation rate is mostly due to demographics - in fact they pull out their calculators to "prove" it. Here is the "latest proof".
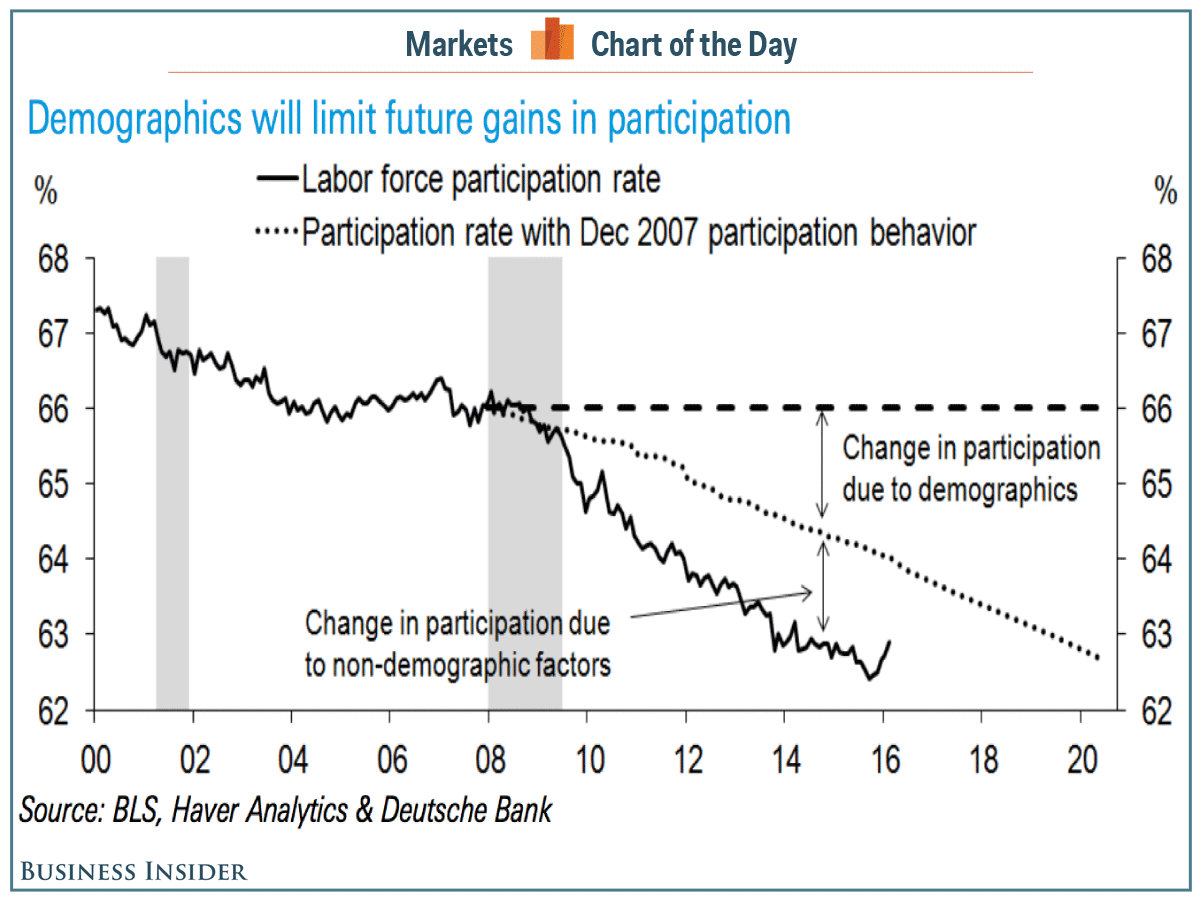
Nothing seems to be wrong with the calculations (I did not validate but they seem in the ballpark). People are living longer, and this will push down the participation rate because the over 65 demographic has the lowest participation rate. To visualize what is happening to the USA population, here is an animation from calculatedriskblog.com.
What is the point of participation rates? - it is to measure employment slack. Riddle me this - if demographics are causing lower participation - then what is wrong with the participation rate of the prime working age population which is not affected directly by demographics?
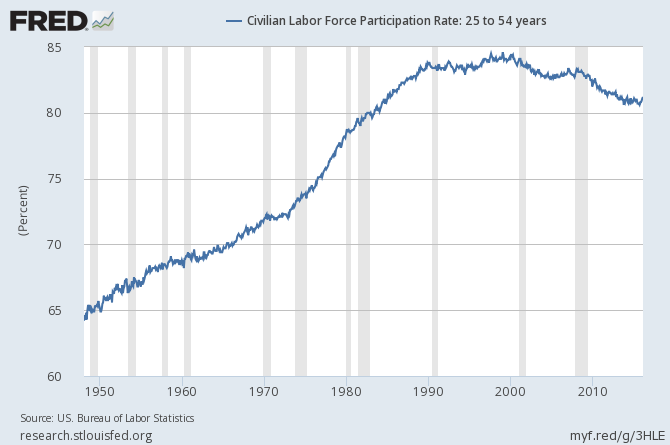
There is too much employment slack. Too many are drinking the spiked Koolaid of the BLS's unrealistic 5.0% unemployment rate. No thinking person believes these metrics accurately portray employment slack - only economists do.
Other Economic News this Week:
The Econintersect Economic Index for April 2016 again insignificantly improved but remains relatively weak. The index continues near one of the lowest values since the end of the Great Recession. This marginal index improvement is due to data being compared against relatively soft data - both month-over-month and year-over-year. Our employment six month forecast is for slightly weaker employment growth for April - and the long term decline in the employment forecast remains in play.
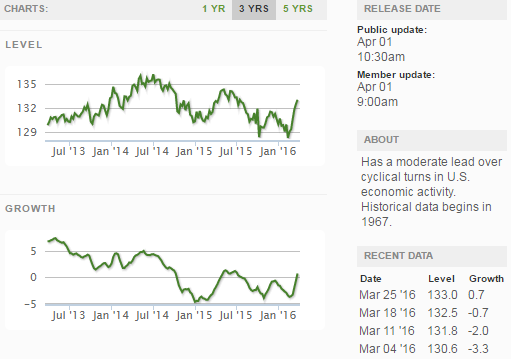
Current ECRI WLI Growth Index
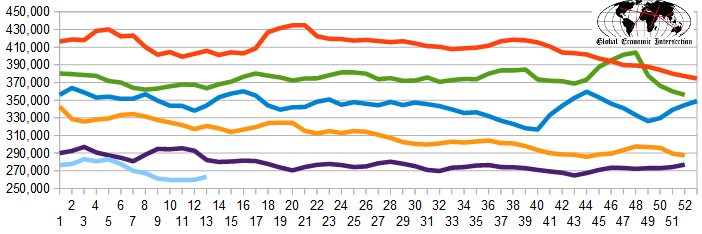
The market expectations (from Bloomberg) were 260,000 to 275,000 (consensus 266,000), and the Department of Labor reported 276,000 new claims. The more important (because of the volatility in the weekly reported claims and seasonality errors in adjusting the data) 4 week moving average moved from 259,750 (reported last week as 259,750) to 263,750. The rolling averages generally have been equal to or under 300,000 since August 2014.
Weekly Initial Unemployment Claims - 4 Week Average - Seasonally Adjusted - 2011 (red line), 2012 (green line), 2013 (blue line), 2014 (orange line), 2015 (violet line)
Bankruptcies this Week: Privately-held Cetera Financial Holdings (f/k/a Finch Holdings), Privately-held Southcross Holdings, Seville, Spain-based Agengoa (Chapter 15), Abeinsa Holding
Click here to view the scorecard table below with active hyperlinks
Weekly Economic Release Scorecard:
