Monitoring purposes GOLD: Gold ETF GLD long at 173.59 on 9/21/11
Long-Term Trend monitor purposes: Flat

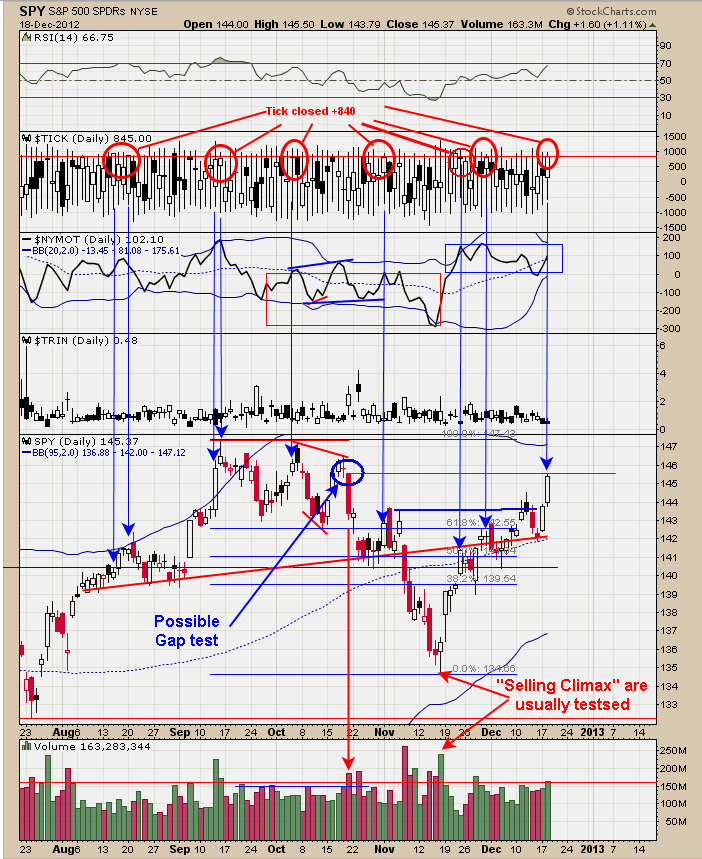
The blue arrows show when the Tick closed above +840 and In all cases the market was near a pull back. In some cases the market just stalled for a couple of weeks or less and in some cases marked market highs (i.e. September 16; October 4). Therefore the Ticks suggest we are very close to a market pull back if not a top.
There is a gap on October 19 at 145.56 that the SPY may try for tomorrow. Tomorrow is also where a cycle high is due. At some point the “Selling Climax” at the November 16 low will be tested and still see that as our downside target. 
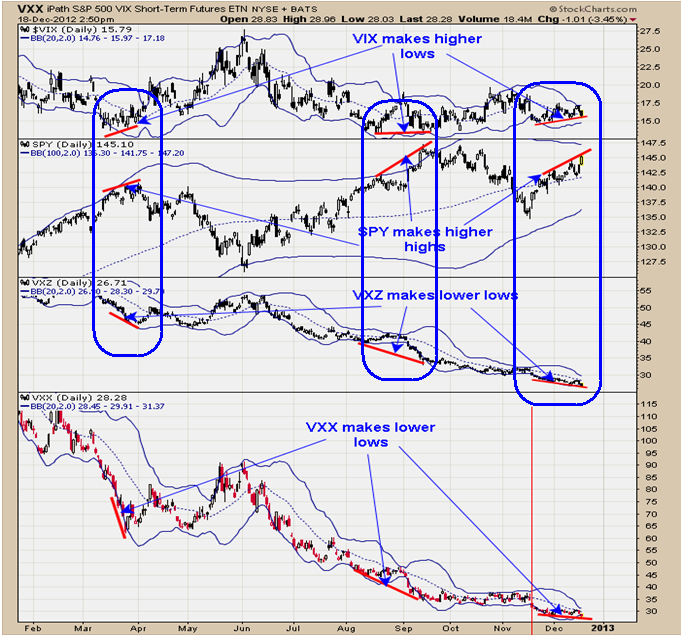
The VXX and VXZ (bottom and second window up respectively) are designed to provide investors with exposure to the S&P 500 VIX short-term and mid-term futures index total return. The VIX measures the implied volatility of the S&P 500 index options also knows as the “Fear index.” The VIX has been making higher lows and as the SPY has been making higher highs along with the VXZ and VXX making lower lows since December 1.
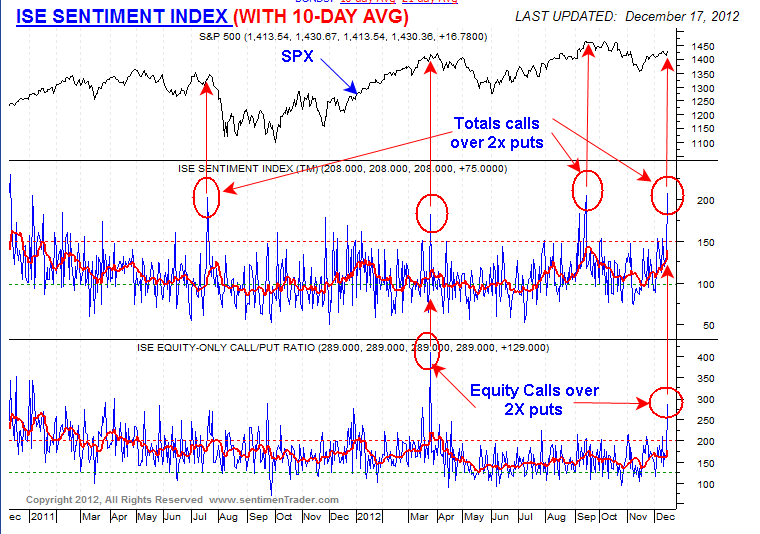
This combination has lead to tops in the SPY. These same divergences where present at the April and September highs of this year. It doesn’t appear a new up-leg in the market is beginning but rather ending. The window below is from “Sentimentrader.com” and shows a surge in call buy (10-day average) over 2X puts and the last three extreme readings marked near highs in the SPX.

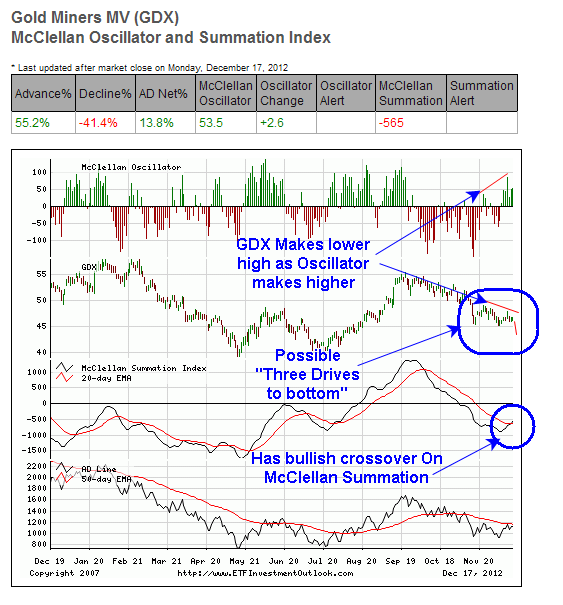
Above is the McClellan Oscillator and Summation index for GDX. The Second window from the bottom is the McClellan Oscillator with a 20 day moving average which has produced a bullish crossover. The next window up is the GDX and next window higher is the McClellan Oscillator. The recent rally from the early December low on GDX made a lower higher but the McClellan Oscillator made a higher high and a positive divergence. The pattern that may be forming is a bullish “Three Drives to Bottom” which would require one more new low below the previous lows starting in November.
We also look at gold and right now the Commitment for Traders report (COT) show that the Small Speculators (dumb money) holding a heavy long position and the Commercials traders holding a heavy short position (smart money) and usually not a good sign for gold metal bulls in the short-term. If gold continues to pull back short term and GDX/GLD ratio holds steady or moves higher would be a very bullish sign for gold stocks and gold indexes.
The conclusion is that Gold indexes and Gold stocks are near a low here. Also remember that XAU/Gold ratio is still below .10 and dating back to 1925 when that ratio got below .10 the gold stocks where on the verge to start an intermediate term rally.
Long NG at 5.14 on 10/8/12. Long GDX 58.65 on 12/6/11. Sold SLV at 30.24 on 12/19/12 = gain 2.6%; Long SLV at 29.48 on 10/20/11. Long GDXJ average 29.75 on 4/27/12. Long GLD at 173.59 on 9/21/11. Long BRD at 1.67 on 8/3/11. Long YNGFF .44 on 7/6/11.
Long EGI at 2.16, on 6/30/11. Long GLD at 147.14 on 6/29/11; stop 170 hit = gain 15.5% . Long KBX at 1.13 on 11/9/10. Long LODE at 2.85 on 1/21/11. Long UEXCF at 2.07 on 1/5/11. We will hold as our core position in AUQ, CDE and KGC because in the longer term view these issues will head much higher. Holding CDE (average long at 27.7. Long cryxf at 1.82 on 2/5/08. KGC long at 6.07. Long AUQ average of 8.25.
