
-
SPX Monitoring purposes; Sold 7/21/20 at 3257.30= gain 1.01%; Long SPX on 7/17/20 at 3224.73.
-
Monitoring purposes GOLD: Long GDX (NYSE:GDX) on 7/8/20 at 38.62.
Long Term Trend SPX monitor purposes; Short SPX 5/13/20 at 2820.
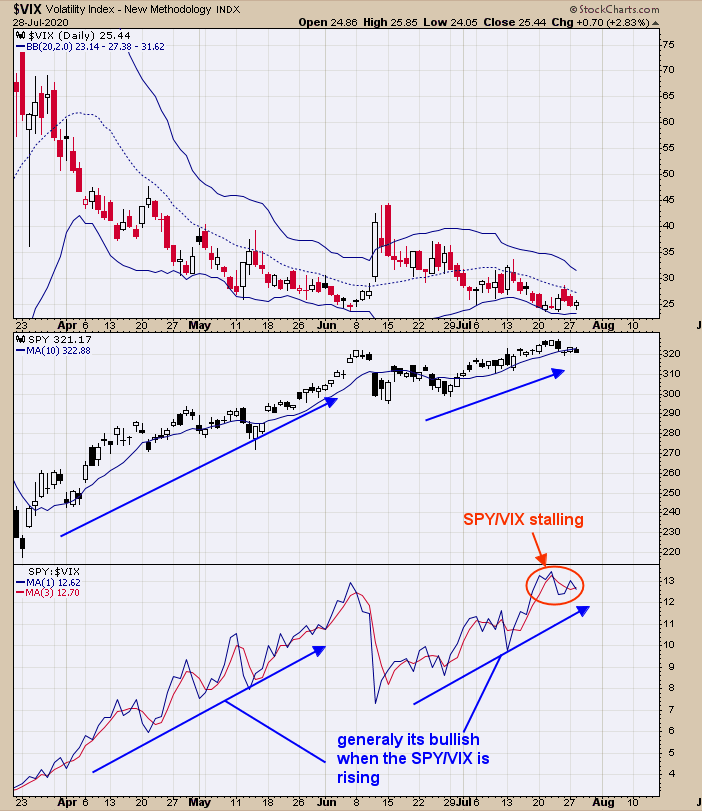
Seasonality has turned bearish for the next couple of months and a time to be careful. The SPDR S&P 500 (NYSE:SPY) is testing the February 24 gap and so far is not backing away. Going into last Wednesday the SPY was up four days in a row suggesting the market will be higher within five days 83% of the time which tomorrow marks the fifth day. The Bottom window is the SPY/VIX ratio. When this ratio is rising, it’s a bullish sign for the SPY. Over the last week, it has flipped sideways predicting a sideways market. The market is not giving a clear signal short term; staying natural for now.
Sold long SPX 7/21/20 at 3257.30= gain 1.01%
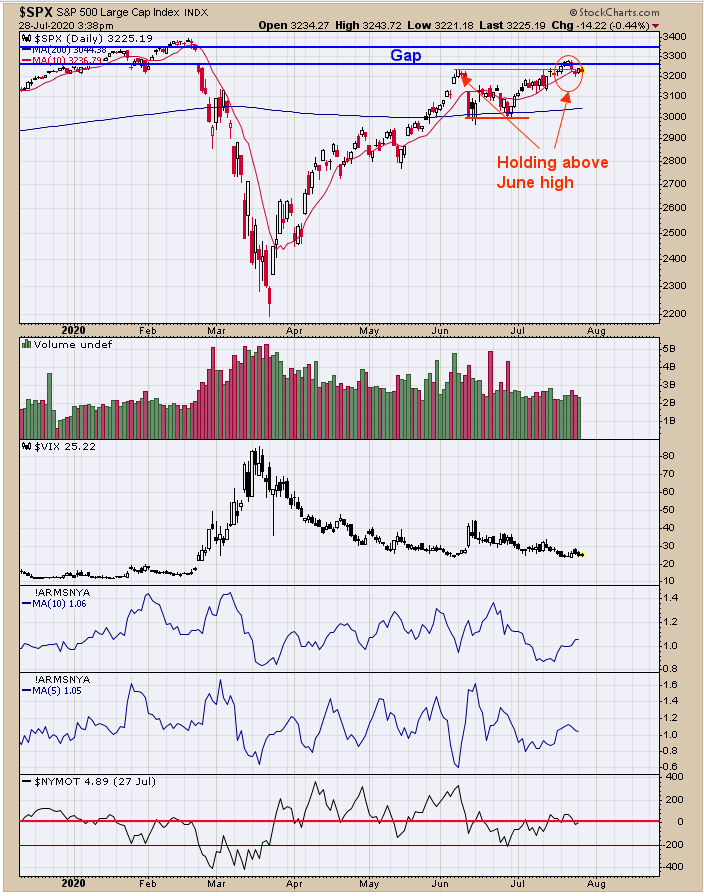
SPX is up against the February gap (resistance) and holding near the June high and not backing away (bullish). The bottom window is the NYSE McClellan Oscillator which closed yesterday at +4.89 (neutral). Next window up is the 5 day average of the TRIN which closed at 1.05 (Neutral). Next window up is the 10 day average of the TRIN which closed at 1.06 and also neutral. For short term there is not a lot to go on, so we will stay neutral for now. Being patient.
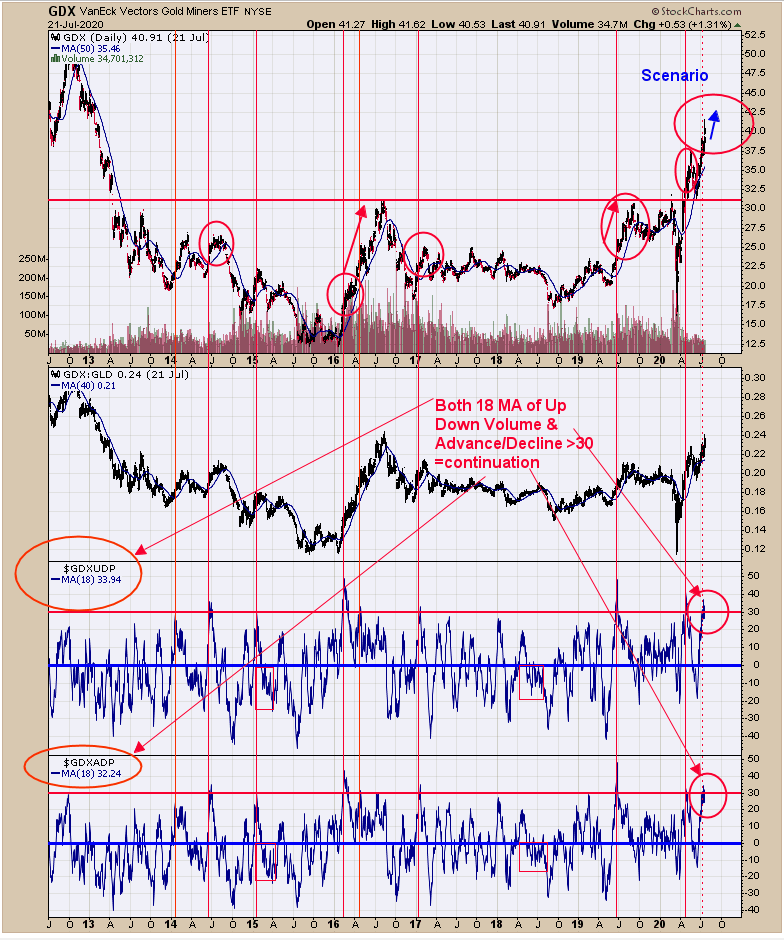
The bottom window is the Advance/Decline percent with an 18 period moving average, next window up is the Up down Volume percent with an 18 period moving average. When both indicators are above 30 (32.24 and 33.94 respectively) the uptrend in GDX continues: in most cases lasted a month or longer. Have been hearing rumors that GDX has gone parabolic and therefore you should sell. According to indictors in this paragraph, the parabolic move may be just beginning.
Long GDX on 7/8/20 at 38.62