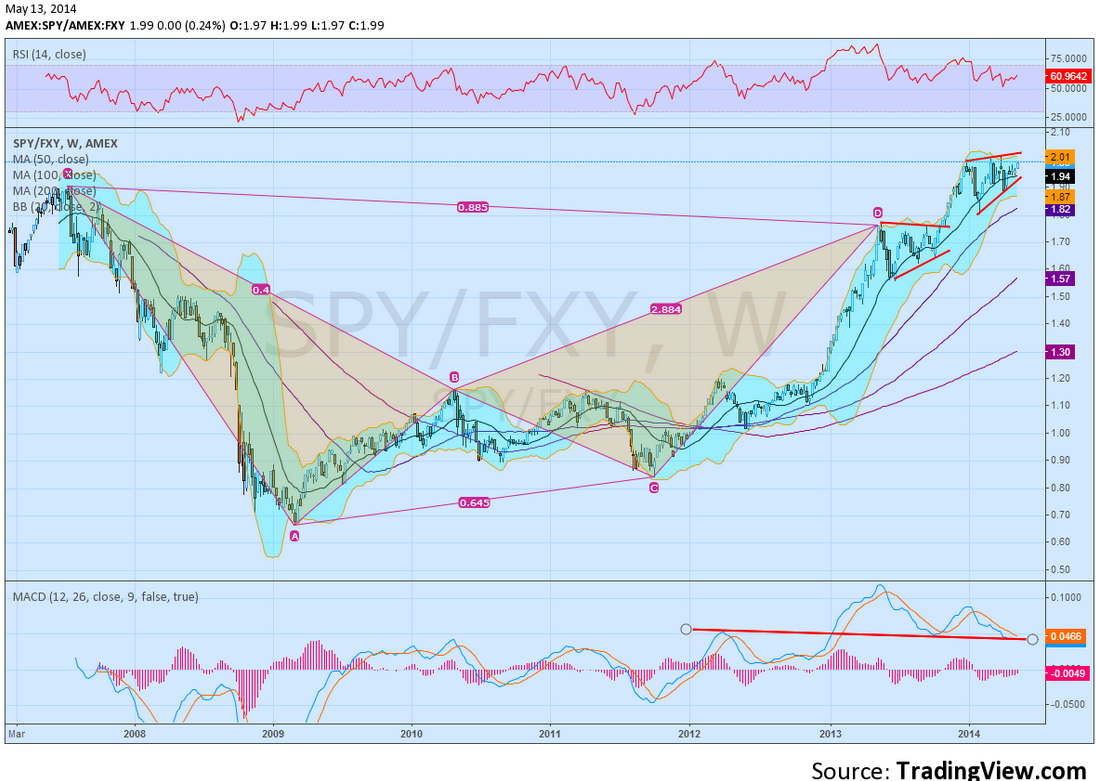
Since early 2012, the S&P 500 ETF, (ARCA:SPY), has had a great run against the yen ETF, RYDEX CurrencyShares Japanese Yen (ARCA:FXY). But where it sits right now seems to be giving conflicting signals. Will it continue to advance or will it revert?

On the plus side, the ratio broke a triangle pattern higher near the end of 2013 and moved up to another triangle. This one is slightly rising but also nearing a breaking point on both the triangle and the ratio of 2.00. There is a bearish Bat harmonic that failed, suggesting that the pattern might morph into a Deep Crab which would target a ratio of 2.67 higher. Also the RSI has remained bullish and is now rising.
The MACD is what brings the continuation of the rally into question. Notice that during the life of the MACD a level under 0.05 has been met with either bearish or flat price action. Once it moved above that level in early 2013 it started moving higher. The MACD has stayed above that level ever since, but is tightening on it in a descending triangle. Will a break lower drag the ratio down? Or will the price action continue higher? Broadly, you can interpret this as a question of whether the divergence in the MACD matters.
Think you just don’t care about the SPY vs the FXY? Well think again. This is exactly what is happening in the weekly chart of the SPY itself as well. The RSI is bullish and turned up with a rising price but a diverging MACD.
From my perspective the MACD is about as lagging an indicator as you might use usefully. The 26 day moving average less the 12 day moving average. Does that really give you better information than the price itself? And look at the level of the MACD. It is often magnified in charts to see the nuance.
But in the one above that, the difference between the 26 day moving average and the 12 day moving average has been between -0.10 and +0.10 almost all the time for the last 6.5 years. Does that really carry any meaning? It is a 5% range on the ratio. The level on the current SPY from -4 to +4 over the last 12 years (ex the financial crisis) is less than that. Divergence can be a signal of a change.
But the key word is CAN. It is not a requirement. As of today you cannot trade the MACD of a stock or ETF. Until you can, stick with the price as you primary indicator and relegate the others to confirmation status or at least understand their relevance.
