
- 30 to 90 days horizons SPX: Flat
- Monitoring purposes GOLD: Gold ETF GLD long at 173.59 on 9/21/11
- Long Term Trend monitor purposes: Flat
- Long GDX 58.65 on 12/6/11
- Long SLV at 29.48 on 10/20/11
- Long GDXJ average 29.75 on 4/27/12
- Long GLD at 173.59 on 9/21/11
- Long BRD at 1.67 on 8/3/11
- Long YNGFF .44 on 7/6/11
- Long EGI at 2.16, on 6/30/11
- Long GLD at 147.14 on 6/29/11; stop 170 hit = gain 15.5%
- Long KBX at 1.13 on 11/9/10
- Long LODE at 2.85 on 1/21/11
- Long UEXCF at 2.07 on 1/5/11
- CDE (average long at 27.7).
- Long cryxf at 1.82 on 2/5/08
- Long KGC at 6.07
- Long AUQ average of 8.25
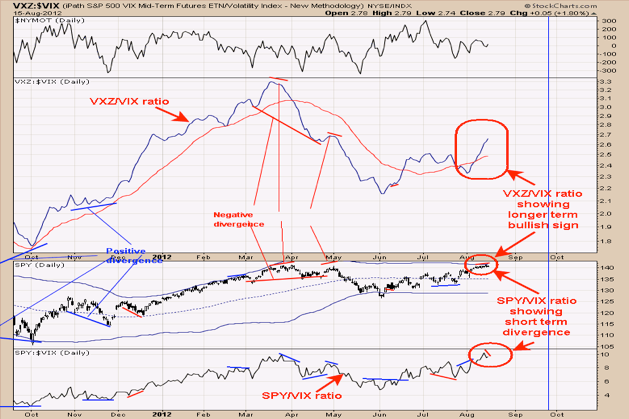
The bottom window is the SPY/VIX ratio is showing a negative divergence where the SPY is trading sideways-to-higher and the SPY/VIX ratio a lower high. The window above the SPY chart is the VXZ/VIX ratio, which normally rises and falls with the SPY. A red moving average was added, which creates bullish and bearish crossovers and previous signals are shown with blue and red arrows that show buy and sell signals respectively. Recently it has given a bullish crossover and remains on the bullish signal, suggesting the larger trend is up. Over the last week the SPY has traded sideways and the SPY/VIX ratio has made higher highs and a bullish development. If the market does pull back, here, we would look for a bullish setup. Since the McClellan Summation index reached +670 (initiation of uptrend), the rally, in general, is expected to continue higher.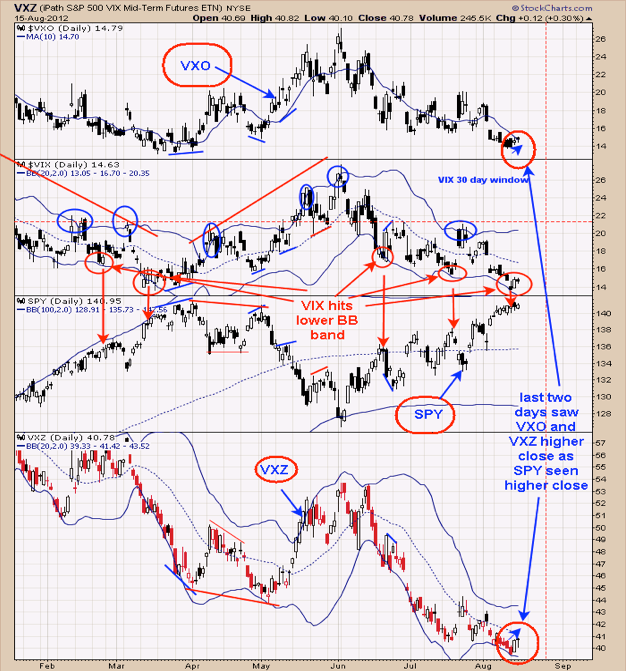
There are some bearish signs for the short term but not to a large degree. Also, this is Option Expiration week, which usually has a bullish bias. The Bottom window is the VXZ and the Top window is the VXO (the old VIX). These two Volatility indexes have moved up the last couple of days and suggest the SPY may be near a short-term high. The VIX (second window down from the top) has run into its lower Bollinger band, which in the past has lead to short-term pull back in the SPY. Play it safe and stay on the sidelines. If the market does pull back -- support near 138 on SPY -- we will look for a bullish setup.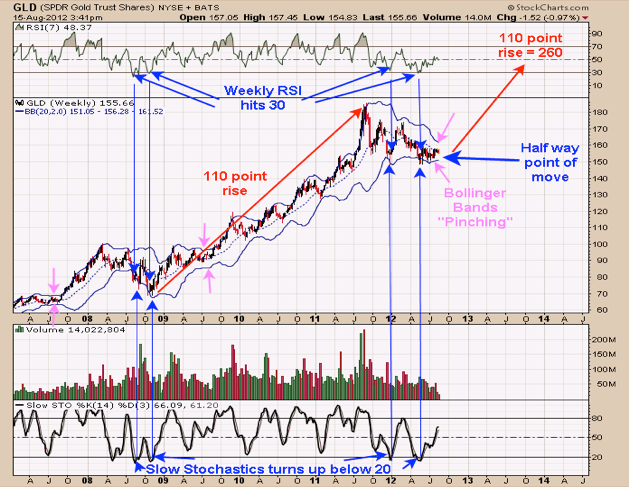
Above is the weekly ETF for gold, which has been in a consolidation mode for a year. The Bollinger bands are now starting to “Pinch”, suggesting an impulse is not far off. Since the commercials are hoarding gold (the smart money) it suggests the impulse wave will set up. Also notice that the weekly RSI hit 30 along with the weekly Stochastics turning up from below 20, which triggered a buy signal. We have marked with pink arrows when the Bollinger bands have pinched together previously, noting the rallies that started soon after. Its common for a consolidation phase to market the half way point of the move and producing the calculation for the current market would give a target near the 260 range on gold. Seasonality is favorable this and next month with September being the best-performing month of the year for gold.
The breakout for gold can start at anytime.
We will hold as our core position in AUQ, CDE and KGC because in the longer-term view, these issues will head much higher. Holding CDE (average long at 27.7).