Last week’s review of the macro market indicators suggested, as the unofficial last week of wummer began, that Gold (GLD) looked to continue higher while Crude Oil (USO) rose in the consolidation zone. The US Dollar Index (UUP) seemed to have found a bottom and should bounce while US Treasuries (TLT) were bouncing but biased lower. The Shanghai Composite (SSEC) looked to drift lower and Emerging Markets (EEM) were biased to the upside in the very short term. Volatility (VIX) looked to remain subdued keeping the bias higher for the equity index ETFs SPY, IWM and QQQ. Their charts saw some upside with the QQQ strongest and IWM next and SPY still needing to prove that the pullback was over.
The week played out with both Gold and Crude Oil moving higher before a pullback late in the week. The US Dollar did bounce late in the week but then retraced while Treasuries continued modestly higher. The Shanghai Composite continued to muddle along in a tight range while Emerging Markets took another gap lower and tried to fill it all week. Volatility bounced off of the lows but remains at subdued level. The Equity Index ETFs all gapped lower and then consolidated the rest of the week. What does this mean for the coming week? Lets look at some charts.
S&P 500 ETF Daily, (SPY)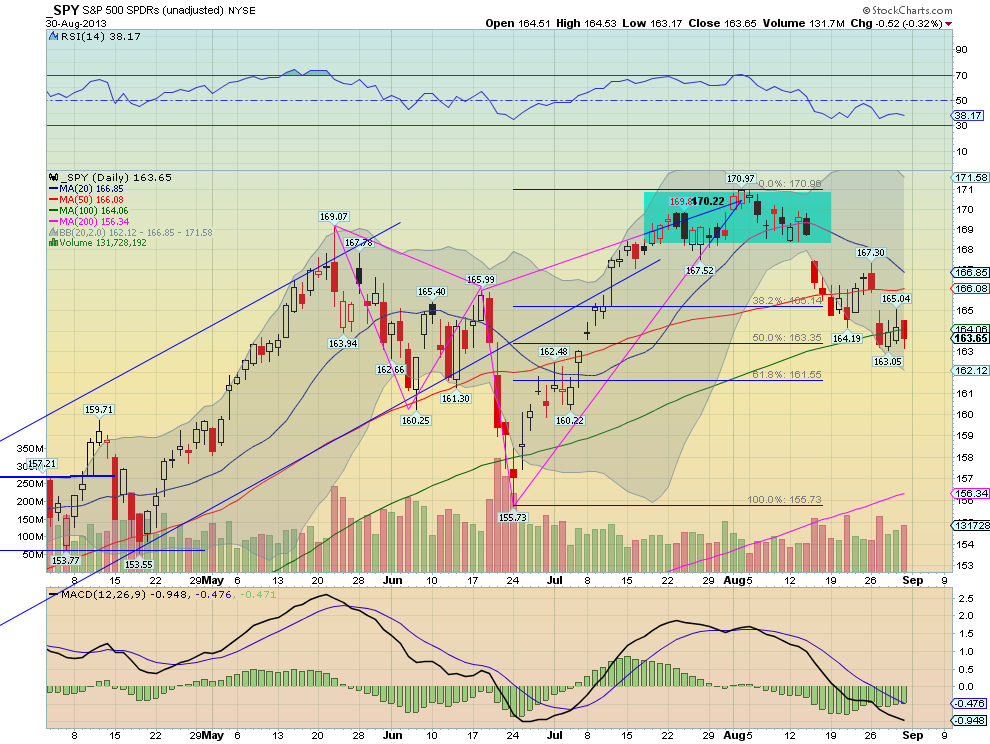
S&P 500 ETF Weekly, (SPY)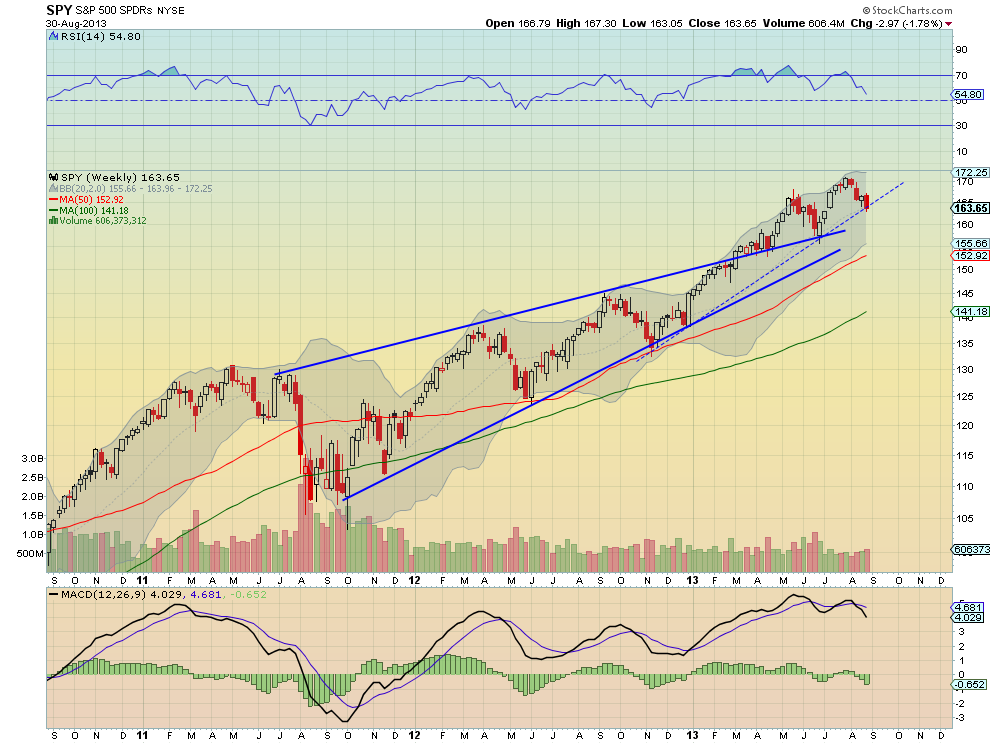
The SPY took it on the chin right from the start of the week. Going into it with a bullish looking short term set up, it printed a Bearish Engulfing Candle Monday and confirmed that with a gap lower Tuesday, under the 100 day Simple Moving Average (SMA). The rest of the week was spent in consolidation around that 100 day SMA, finishing below it. The daily chart shows the Relative Strength Index (RSI) moving sideways in bearish territory with a Moving Average Convergence Divergence indicator (MACD) that is heading lower. The histogram though is slowly improving. The 61.8% retracement of the Shark down to 161.55 is the next target lower on that pattern as well and coming close. On the weekly picture the picture is looking lower as well but not nearly as grim. The RSI is making a new low but remains in bullish territory. Watch this as the price is not making a new low and any reversal before 155.73 would trigger a Positive RSI Reversal looking for a new all time high. It is also at support of the rising trendline from November. On the bad side of the ledger the weekly Bearish Engulfing Candle signals lower if confirmed next week and the MACD is making new lows and heading down. It is premature to call for it but the SPY has not seen the 50 week SMA since November. There is support lower at 163 and 161.60 followed by 160.20 and 158.10. A break below 155.73 turns this into a lasting bearish downturn. Resistance higher comes at 164.50 and 166 followed by 167.45. Over that and a gap fill to 168.70 brightens the smiles of many bulls. Downside Short Term Bias in the Long Term Uptrend.
As September begins look for Gold to continue to bounce in its downtrend while Crude Oil rises with a chance of consolidation. The US Dollar Index looks to be reversing higher while US Treasuries are biased higher in the short term in their downtrend. The Shanghai Composite looks to continue to consolidate with an upward bias as Emerging Markets are poised to move lower. Volatility looks to remain subdued but creeping higher keeping the wind at the backs of the equity index ETF’s SPY, IWM and QQQ, despite the moves lower this week. Their charts suggest that the downside is not over yet though with the SPY and IWM looking lower while the QQQ looks the strongest and most likely to just consolidate instead of falling. Use this information as you prepare for the coming week and trad’em well.
Disclosure: The information in this blog post represents my own opinions and does not contain a recommendation for any particular security or investment. I or my affiliates may hold positions or other interests in securities mentioned in the Blog, please see my Disclaimer page for my full disclaimer.
Original post
- English (UK)
- English (India)
- English (Canada)
- English (Australia)
- English (South Africa)
- English (Philippines)
- English (Nigeria)
- Deutsch
- Español (España)
- Español (México)
- Français
- Italiano
- Nederlands
- Português (Portugal)
- Polski
- Português (Brasil)
- Русский
- Türkçe
- العربية
- Ελληνικά
- Svenska
- Suomi
- עברית
- 日本語
- 한국어
- 简体中文
- 繁體中文
- Bahasa Indonesia
- Bahasa Melayu
- ไทย
- Tiếng Việt
- हिंदी
SPY Trends: Gold Higher, Oil In Consolidation Zone, USD Finds Bottom
Published 09/01/2013, 02:53 AM
Updated 05/14/2017, 06:45 AM
SPY Trends: Gold Higher, Oil In Consolidation Zone, USD Finds Bottom
Latest comments
Loading next article…
Install Our App
Risk Disclosure: Trading in financial instruments and/or cryptocurrencies involves high risks including the risk of losing some, or all, of your investment amount, and may not be suitable for all investors. Prices of cryptocurrencies are extremely volatile and may be affected by external factors such as financial, regulatory or political events. Trading on margin increases the financial risks.
Before deciding to trade in financial instrument or cryptocurrencies you should be fully informed of the risks and costs associated with trading the financial markets, carefully consider your investment objectives, level of experience, and risk appetite, and seek professional advice where needed.
Fusion Media would like to remind you that the data contained in this website is not necessarily real-time nor accurate. The data and prices on the website are not necessarily provided by any market or exchange, but may be provided by market makers, and so prices may not be accurate and may differ from the actual price at any given market, meaning prices are indicative and not appropriate for trading purposes. Fusion Media and any provider of the data contained in this website will not accept liability for any loss or damage as a result of your trading, or your reliance on the information contained within this website.
It is prohibited to use, store, reproduce, display, modify, transmit or distribute the data contained in this website without the explicit prior written permission of Fusion Media and/or the data provider. All intellectual property rights are reserved by the providers and/or the exchange providing the data contained in this website.
Fusion Media may be compensated by the advertisers that appear on the website, based on your interaction with the advertisements or advertisers.
© 2007-2025 - Fusion Media Limited. All Rights Reserved.