Last week’s review of the macro market indicators suggested, heading into the last 2 months of the year the markets still looked positive but might need a short term pullback. It looked for Gold (GLD) and Crude Oil (USO) to continue lower. The US Dollar Index (UUP) wanted to move higher while US Treasuries (TLT) were biased lower. The Shanghai Composite (SSEC) might consolidate but it and Emerging Markets (EEM) were biased to the downside. Volatility (VIX) looked to remain subdued keeping the bias higher for the equity index ETF’s SPY, IWM and QQQ. Their charts suggested a possible pullback continuing for the IWM, with the QQQ possibly joining it and the SPY consolidating but maybe ready to reverse higher again.
The week played out with Gold hovering in consolidation be fore a hard fall too end the week while Crude Oil may have found a bottom and is trying to bounce. The US Dollar consolidated the bounce from last week before advancing to end the week higher while Treasuries continued lower. The Shanghai Composite continued in a narrow range, drifting lower while Emerging Markets continued lower but ended the week with a potential bottoming candle. Volatility continued to hold at the lows keeping the wind at the backs of Equity markets. The Equity Index ETF’s had a crazy week, starting out muted before a hard drop Thursday only to recover most of it Friday. What does this mean for the coming week? Lets look at some charts.
SPY Daily, SPY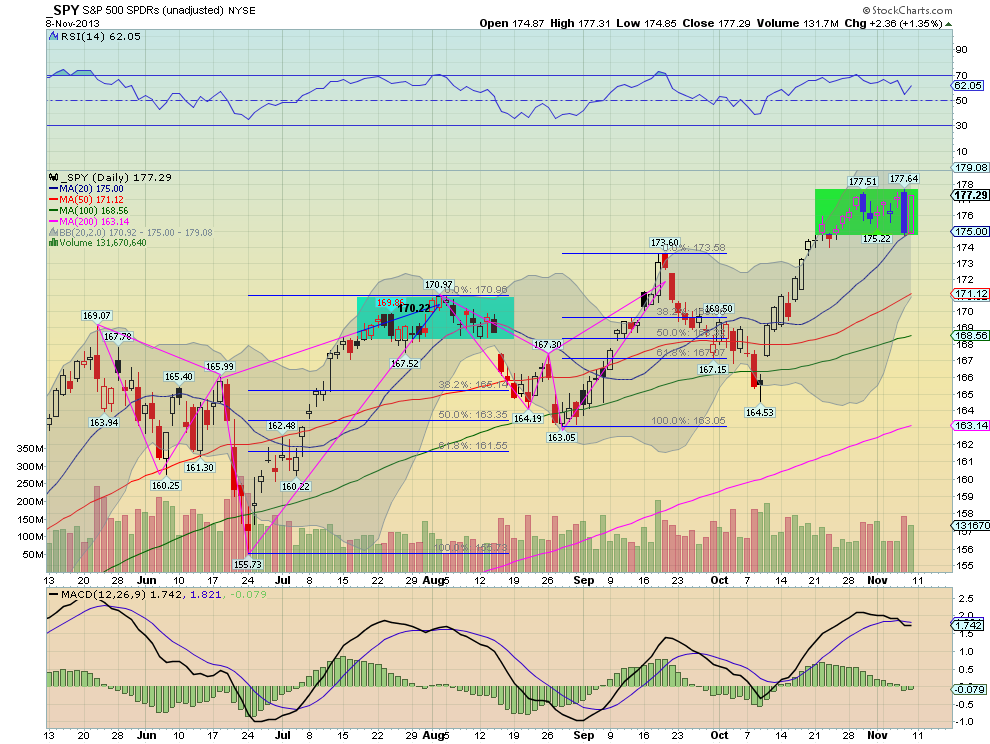
SPY Weekly, SPY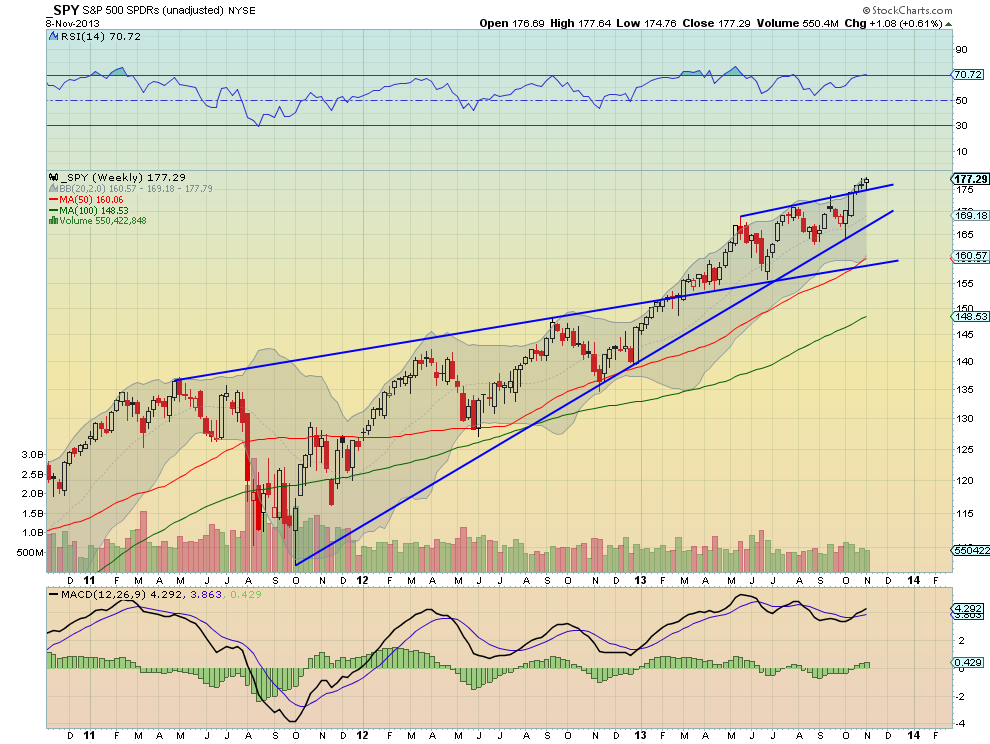
The SPY began the week the way that it ended last week, a series of tight potentially topping candles. The bears eyes lit up on Thursday as the price fell precipitously to the 20 day SMA but it then rebounded with a strong Marubozu candle Friday to recover most of Thursday’s ground and close at a new all time high closing level. The daily chart shows that the movement since late October can be viewed as a consolidation zone between 174.75 and 177.64. The RSI on the daily chart recovered with the price and is moving back higher but the MACD is moving lower. It may be leveling, and if so, then both would support further upside on this timeframe. The weekly chart is showing consolidation above a rising trendline break higher with a move this week that may start a break up. The RSI is leveling just over 70, not too hot, and the MACD is moving back higher, so both support the upside. Support lower comes at 175.93 and 174.75 followed by 173.60 and 170.97. Resistance is found higher at 177.65 and then there is a Fibonacci extension to 179.11, with a Measured Move to 187.75 above. Consolidation with an Upward Bias.
Heading into November options expiration week the markets got rattled but came back strong. Look for Gold to continue lower with Crude Oil, although the latter is at a spot that could provide a reversal higher. The US Dollar Index remains strong and looks better higher while US Treasuries are biased to continue lower. The Shanghai Composite and Emerging Markets are biased to the downside with the risk of the Chinese market running in place like last week. Volatility looks to remain subdued keeping the bias higher for the equity index ETF’s SPY, IWM and QQQ. Their charts show better strength in the SPY followed by the QQQ and then the IWM the weakest, but none in full blown drive higher every day mode. Use this information as you prepare for the coming week and trad’em well.
Disclosure: The information in this blog post represents my own opinions and does not contain a recommendation for any particular security or investment. I or my affiliates may hold positions or other interests in securities mentioned in the Blog, please see my Disclaimer page for my full disclaimer.
Original post
- English (UK)
- English (India)
- English (Canada)
- English (Australia)
- English (South Africa)
- English (Philippines)
- English (Nigeria)
- Deutsch
- Español (España)
- Español (México)
- Français
- Italiano
- Nederlands
- Português (Portugal)
- Polski
- Português (Brasil)
- Русский
- Türkçe
- العربية
- Ελληνικά
- Svenska
- Suomi
- עברית
- 日本語
- 한국어
- 简体中文
- 繁體中文
- Bahasa Indonesia
- Bahasa Melayu
- ไทย
- Tiếng Việt
- हिंदी
SPY Trends: Consolidation With An Upward Bias
Published 11/09/2013, 11:49 AM
SPY Trends: Consolidation With An Upward Bias
Latest comments
Loading next article…
Install Our App
Risk Disclosure: Trading in financial instruments and/or cryptocurrencies involves high risks including the risk of losing some, or all, of your investment amount, and may not be suitable for all investors. Prices of cryptocurrencies are extremely volatile and may be affected by external factors such as financial, regulatory or political events. Trading on margin increases the financial risks.
Before deciding to trade in financial instrument or cryptocurrencies you should be fully informed of the risks and costs associated with trading the financial markets, carefully consider your investment objectives, level of experience, and risk appetite, and seek professional advice where needed.
Fusion Media would like to remind you that the data contained in this website is not necessarily real-time nor accurate. The data and prices on the website are not necessarily provided by any market or exchange, but may be provided by market makers, and so prices may not be accurate and may differ from the actual price at any given market, meaning prices are indicative and not appropriate for trading purposes. Fusion Media and any provider of the data contained in this website will not accept liability for any loss or damage as a result of your trading, or your reliance on the information contained within this website.
It is prohibited to use, store, reproduce, display, modify, transmit or distribute the data contained in this website without the explicit prior written permission of Fusion Media and/or the data provider. All intellectual property rights are reserved by the providers and/or the exchange providing the data contained in this website.
Fusion Media may be compensated by the advertisers that appear on the website, based on your interaction with the advertisements or advertisers.
© 2007-2025 - Fusion Media Limited. All Rights Reserved.