Last week’s review of the macro market indicators suggested, heading into the first Options Expiration of the year that the equity markets had survived a scare but looked mixed. The week looked for Gold (GLD) and Crude Oil (USO) to bounce in their downtrends. The US Dollar Index (UUP) was now biased lower while US Treasuries (TLT) were biased higher in the short run. The Shanghai Composite (SSEC) and Emerging Markets (EEM) were biased to the downside with risk of the Emerging Markets bouncing higher. Volatility (VIX) looked to remain subdued and biased lower keeping the bias higher for the equity index ETF’s SPY, IWM and QQQ. Their charts were decidedly mixed though with the IWM looking strongest and better to the upside, while the SPY looked a bit more fragile but still better higher and the QQQ the worst and looking sideways.
The week played out with Gold holding its gains from last week while Crude Oil bounced off of support closing higher. The US Dollar found support below and drifted slightly higher while Treasuries made a move higher to new 2 month highs. The Shanghai Composite dragged along the 2000 level while and Emerging Markets held in place. Volatility continued to hold at the recent lows keeping that tailwind blowing. The Equity Index ETF’s started the week lower but bounced quickly making new highs before giving some back Friday. What does this mean for the coming week? Lets look at some charts.
SPY Daily, SPY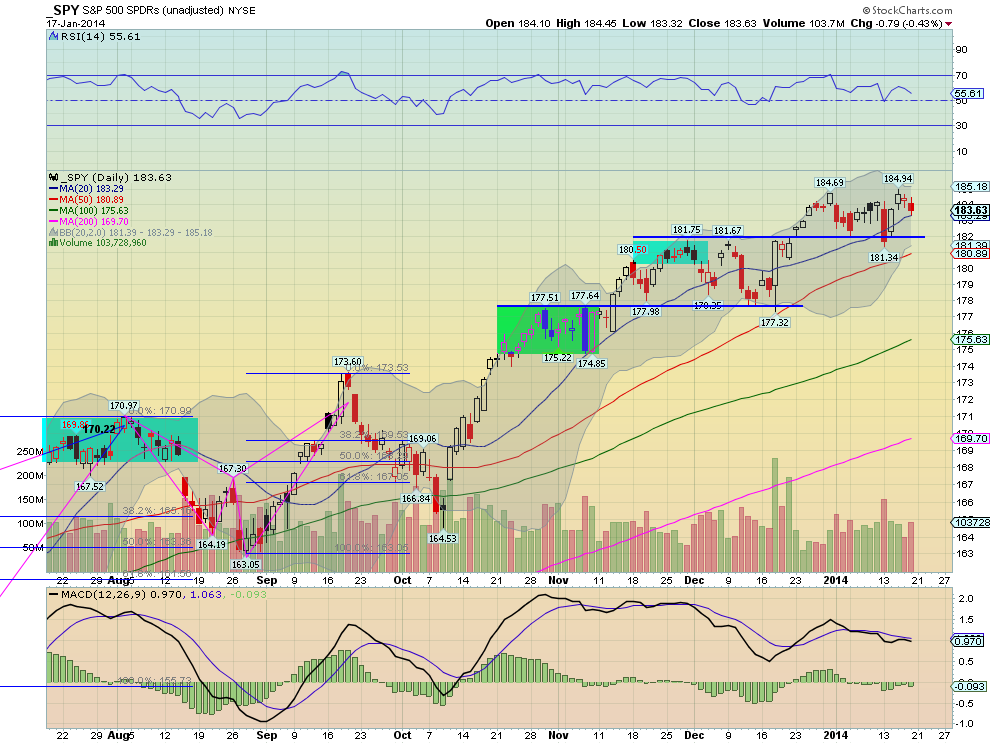
SPY Weekly, SPY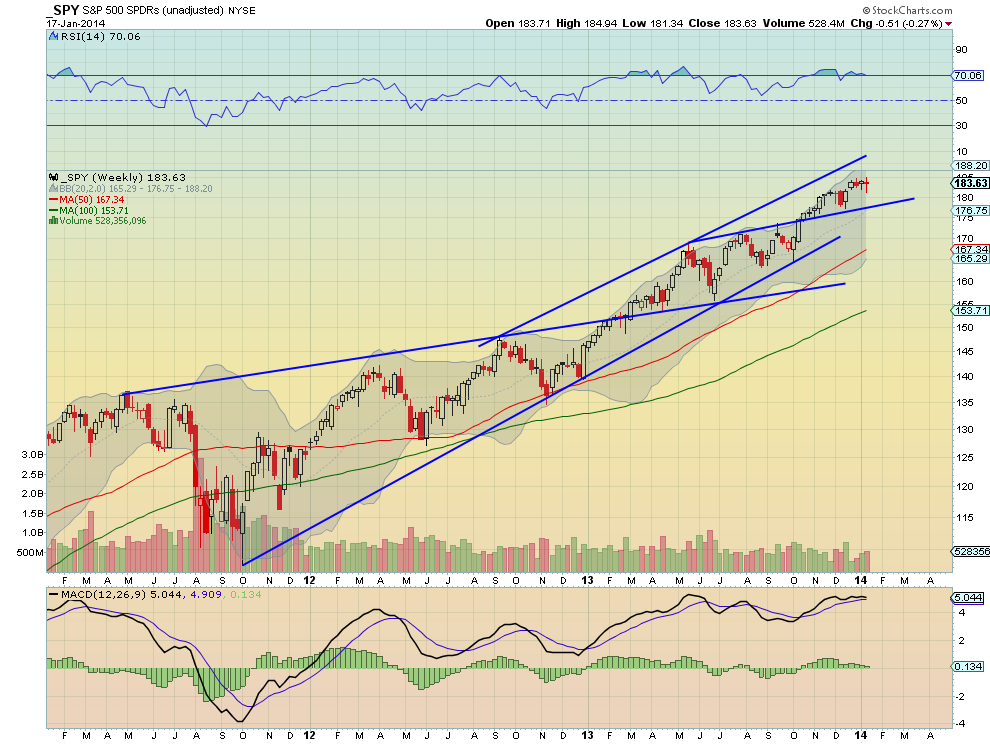
The SPY started the week lower, retesting and breaking the prior break out level at 181.80 before bouncing and moving to a new intraday all time high. From there it pulled back to end the week at the 20 day SMA. The RSI made a lower high and bears will glom onto this as a sign of a topping process, and the MACD is continuing lower on the daily chart. It is not a strong chart but hardly weak. On the weekly chart the doji makes 4 weeks in a row with a small body candle, the difference with this one is that it closed the gap from 4 weeks ago. The RSI is bullish and riding the 70 level sideways with the MACD flattening. There is resistance at 184.94-185 and then Measured Moves higher to 186 and 193. Support lower comes at 183 and 181.80 followed by 180.40. Consolidation in the Uptrend Protecting the Downside.
As the new week begins the equity markets look mixed but biased higher. Look for Gold to continue higher short term in its downtrend while Crude Oil rises in the consolidation zone lower. The US Dollar Index seems ready to move higher while US Treasuries are also biased higher in consolidation. The Shanghai Composite and Emerging Markets remain biased to the downside. Volatility looks to remain subdued keeping the bias higher for the equity index ETF’s SPY, IWM and QQQ. Their charts are mixed with the SPY the weakest and looking like consolidation at best in the short run, with the QQQ next and the IWM the strongest looking higher. Use this information as you prepare for the coming week and trad’em well.
Disclaimer: The information in this blog post represents my own opinions and does not contain a recommendation for any particular security or investment. I or my affiliates may hold positions or other interests in securities mentioned in the Blog, please see my Disclaimer page for my full disclaimer.
Original post
- English (UK)
- English (India)
- English (Canada)
- English (Australia)
- English (South Africa)
- English (Philippines)
- English (Nigeria)
- Deutsch
- Español (España)
- Español (México)
- Français
- Italiano
- Nederlands
- Português (Portugal)
- Polski
- Português (Brasil)
- Русский
- Türkçe
- العربية
- Ελληνικά
- Svenska
- Suomi
- עברית
- 日本語
- 한국어
- 简体中文
- 繁體中文
- Bahasa Indonesia
- Bahasa Melayu
- ไทย
- Tiếng Việt
- हिंदी
SPY Trends: Consolidation In The Uptrend, Protecting The Downside
Published 01/18/2014, 10:39 AM
Updated 05/14/2017, 06:45 AM
SPY Trends: Consolidation In The Uptrend, Protecting The Downside
Latest comments
Loading next article…
Install Our App
Risk Disclosure: Trading in financial instruments and/or cryptocurrencies involves high risks including the risk of losing some, or all, of your investment amount, and may not be suitable for all investors. Prices of cryptocurrencies are extremely volatile and may be affected by external factors such as financial, regulatory or political events. Trading on margin increases the financial risks.
Before deciding to trade in financial instrument or cryptocurrencies you should be fully informed of the risks and costs associated with trading the financial markets, carefully consider your investment objectives, level of experience, and risk appetite, and seek professional advice where needed.
Fusion Media would like to remind you that the data contained in this website is not necessarily real-time nor accurate. The data and prices on the website are not necessarily provided by any market or exchange, but may be provided by market makers, and so prices may not be accurate and may differ from the actual price at any given market, meaning prices are indicative and not appropriate for trading purposes. Fusion Media and any provider of the data contained in this website will not accept liability for any loss or damage as a result of your trading, or your reliance on the information contained within this website.
It is prohibited to use, store, reproduce, display, modify, transmit or distribute the data contained in this website without the explicit prior written permission of Fusion Media and/or the data provider. All intellectual property rights are reserved by the providers and/or the exchange providing the data contained in this website.
Fusion Media may be compensated by the advertisers that appear on the website, based on your interaction with the advertisements or advertisers.
© 2007-2025 - Fusion Media Limited. All Rights Reserved.