Last week’s review of the macro market indicators noted with January in the books as the best in 30 years and the first week of February ahead, equity markets continued to look strong as they pushed higher. Elsewhere looked for NYSE:Gold ($GLD) to continue in its uptrend while Crude Oil ($USO) looked to break higher as well. The U.S. Dollar Index ($DXY) continued to mark time moving sideways while U.S. Treasuries ($TLT) were at resistance.
The NYSE:Shanghai Composite ($ASHR) was building a reversal into the Lunar New Year holidays and Emerging Markets ($EEM) had confirmed a reversal higher. Volatility ($VXXB) looked to remain low and falling keeping the breeze at the backs of the equity index ETF’s $SPY, $IWM and $QQQ. Their charts showed a possible pause in the short term but the longer picture continued to look strong, as they closed in on printing the first higher high since the drop.
The week played out with Gold pulling back to retest support then reversing back higher while Crude Oil moved lower all week. The U.S. dollar moved slightly higher while Treasuries moved higher. The Shanghai Composite was enjoying its New Year’s holiday week while Emerging Markets fell back to retest the breakout area.
Volatility held in a tight range but drifted higher to weigh down equities. The Equity Index ETF’s all started the week moving higher and then one by one rolled over. The SPY (NYSE:SPY) led the way Wednesday with the IWM and QQQ joining it on Thursday. What does this mean for the coming week? Let’s look at some charts.
SPY Daily, $SPY

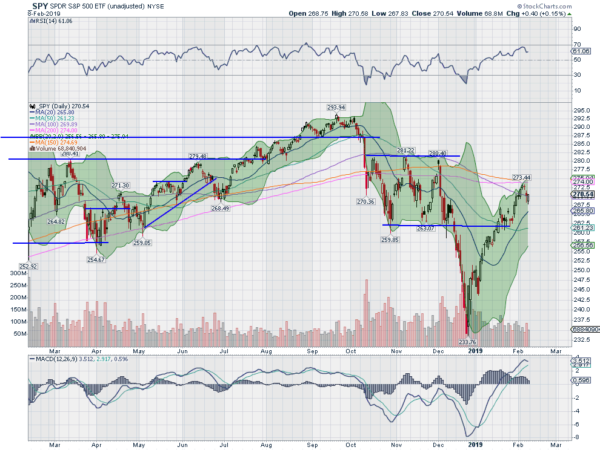
The SPY came into the week heading higher but still short of declaring the bottom is in. It continued higher Monday and Tuesday reaching just shy of its 200-day SMA. A doji Wednesday and then it pulled back Thursday. Friday started lower but recovered and ended with a strongpush-upp. It ended the week slightly positive.
The daily chart shows the pullback started as the price touched the upper Bollinger Band®. It also shows the RSI now reset lower from a touch at overbought Tuesday with the MACD level. Both remain in the bullish zone, and price remains over the 20-day SMA.
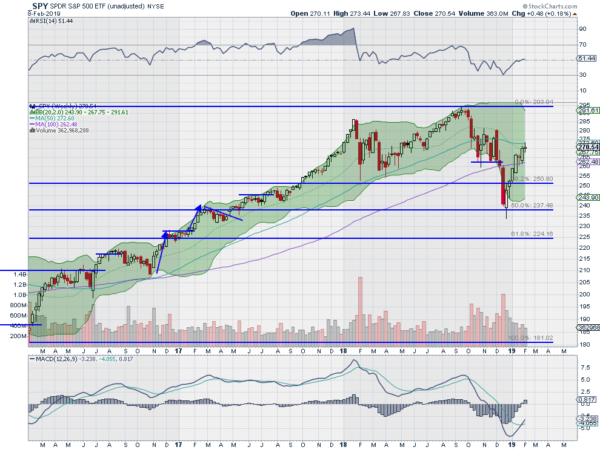
The weekly chart shows the RSI struggling as it hits the midline with the MACD crossed up but still negative. The small body candle stalled right at the 50-week SMA. There is resistance at 271.40 and 272.50 then 274.50 and 277.50. Support lower comes at 269 and 265 then 263 and 261. Uptrend.
SPY Weekly, $SPY

Heading into February Options Expiration the equity markets saw their first signs of weakness this year. They did recover to post positive weeks, but the fatigue was evident. Elsewhere look for Gold to resume its uptrend while Crude Oil may be reversing lower. The U.S. Dollar Index continues to mark time moving sideways in broad consolidation while U.S. Treasuries are at resistance as they move higher. The Shanghai Composite reopens with a positive outlook and Emerging Markets are pausing in their move higher.
Volatility looks to remain at low levels making it easier for equities to advance. Their charts show digestion of the 6-week move higher in the shorter timeframe as the SPY, IWM and QQQ all held over their 20-day SMA’s. The longer timeframe sees the uptrend intact but with some indecision in the short run. Use this information as you prepare for the coming week and trade them well.
Disclaimer: The information in this blog post represents my own opinions and does not contain a recommendation for any particular security or investment. I or my affiliates may hold positions or other interests in securities mentioned in the Blog, please see my Disclaimer page for my full disclaimer.
