SPY Trends And Influencers

Last week’s review of the macro market indicators saw heading into the shortened pre-Easter week that the equity markets continued to grind higher but remained short of their all-time highs. Elsewhere looked for Gold ($GLD) to consolidate in a tightening triangle while Crude Oil ($USO) advanced higher. The US Dollar Index ($DXY) continued to consolidate sideways while US Treasuries ($TLT) pulled back retesting their break out.
The Shanghai Composite ($ASHR) looked to pause in its uptrend while Emerging Markets ($EEM) were biased to head higher. Volatility ($VXXB) looked to remain at very low levels keeping the bias higher for the equity index ETF’s ($SPY), $IWM and $QQQ. The $SPY and $QQQ seemed ready to retest their all-time highs while the $IWM was gotten caught up at resistance and continued to churn sideways.
The week played out with Gold breaking that triangle to the downside and dropping while Crude Oil consolidated in less than a $2 range. The US Dollar moved slightly higher in consolidation while Treasuries gapped down Monday and held lower. The Shanghai Composite found support in its bull flag and reversed while Emerging Markets continued to hold after their break higher.
Volatility basically held at last week’s low levels, keeping the bias higher for equities. The Equity Index ETF’s held steady Monday with the SPY sticking tight to 290 all week. The QQQ moved higher to test the all-time highs though and the IWM, however, pulled back from resistance, the weakest of the bunch. What does this mean for the coming week? Let’s look at some charts.
SPY Daily, $SPY

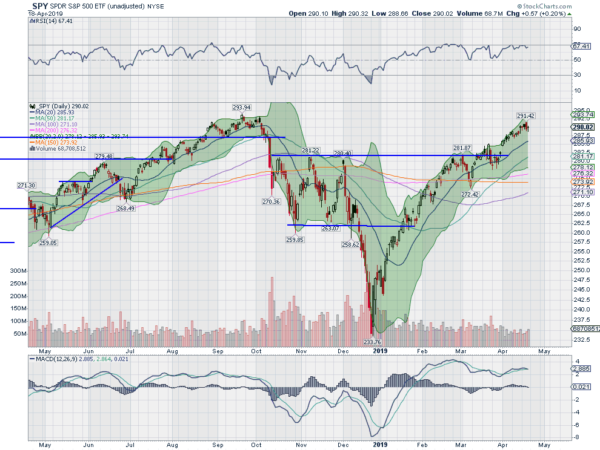
The SPY came into the week at a 6 month high and just shy of the all-time high. It started Monday holding there and continued the rest of the week maintaining a tight range. A pretty unexciting week. The daily chart shows the RSI holding strong in the bullish zone with the MACD leveling and positive.
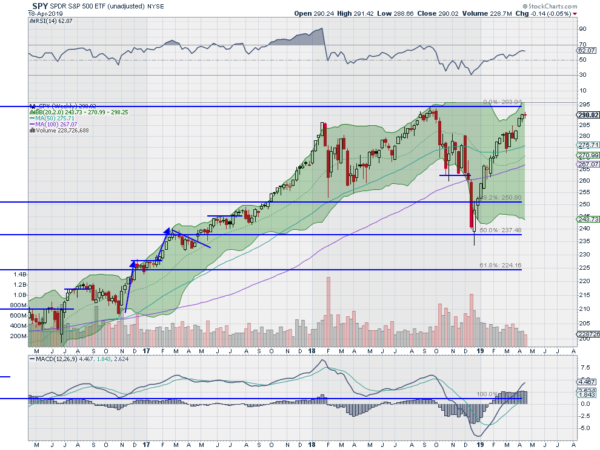
The weekly chart printed a tight doji candlestick at the round number 290 to close out April options expiration. The RSI is rising in the bullish zone with the MACD moving up and positive. There is resistance above at 292 and 294. Support under the 289.50 to 290.50 range comes at 287 and 285 then 284 and 282. Pause in Uptrend.
SPY Weekly, $SPY

With April Options Expiration behind, the equity markets held up well and still look strong. Elsewhere look for Gold to head lower while Crude Oil pauses in its move higher. The US Dollar Index looks to continue to move sideways while US Treasuries may be ending their pullback. The Shanghai Composite and Emerging Markets look to continue to move to the upside.
Volatility looks to remain very low keeping the bias higher for the equity index ETF’s SPY, IWM and QQQ. Their charts are a bit mixed though in the shorter timeframe with the QQQ strong and heading higher, the SPY consolidating and the IWM retrenching. All three look stronger in the weekly timeframe. Use this information as you prepare for the coming week and trad’em well.
Disclaimer:
The information in this blog post represents my own opinions and does not contain a recommendation for any particular security or investment. I or my affiliates may hold positions or other interests in securities mentioned in the Blog, please see my Disclaimer page for my full disclaimer.
