Monitoring purposes GOLD: Gold ETF GLD long at 173.59 on 9/21/11
Long-Term Trend monitor purposes: Flat

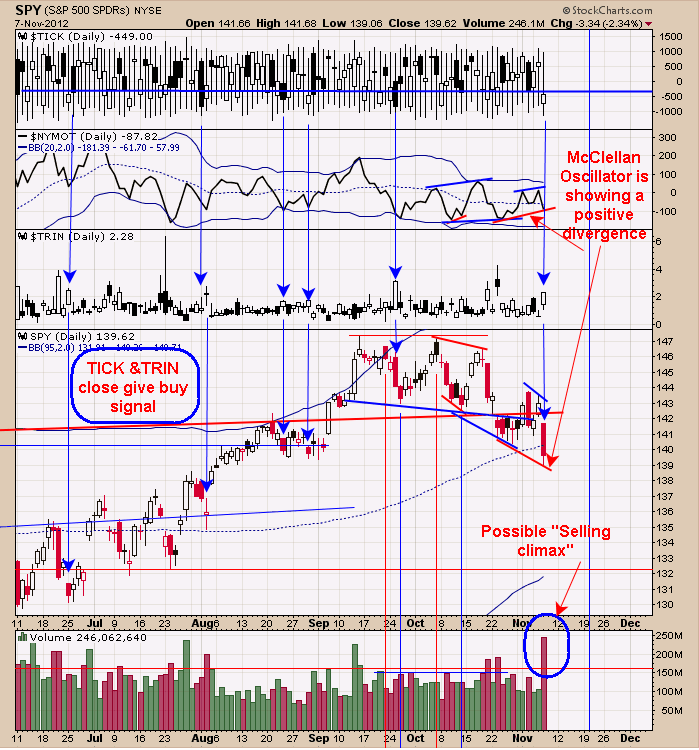
The McClellan Oscillator is showing a bullish divergence where the SPY is trending sideways to down over the last month and the McClellan Oscillator has made higher lows and higher highs and suggests there is internal strength showing up in the market. The blue arrows above show when the TICK closed < minus 450 and the TRIN closed above 1.48.
When these numbers are met or exceeded than expect a bottom as early as today to as late as two day’s later. Today’s Ticks closed at -449 (close enough) and the TRIN closed at 2.28 suggests the market hit a low today or as late as Friday. Also notice that volume over doubled from yesterday and suggests a “Selling climax” day and another bullish sign. We are still expecting one more rise that may hit above the September high. 
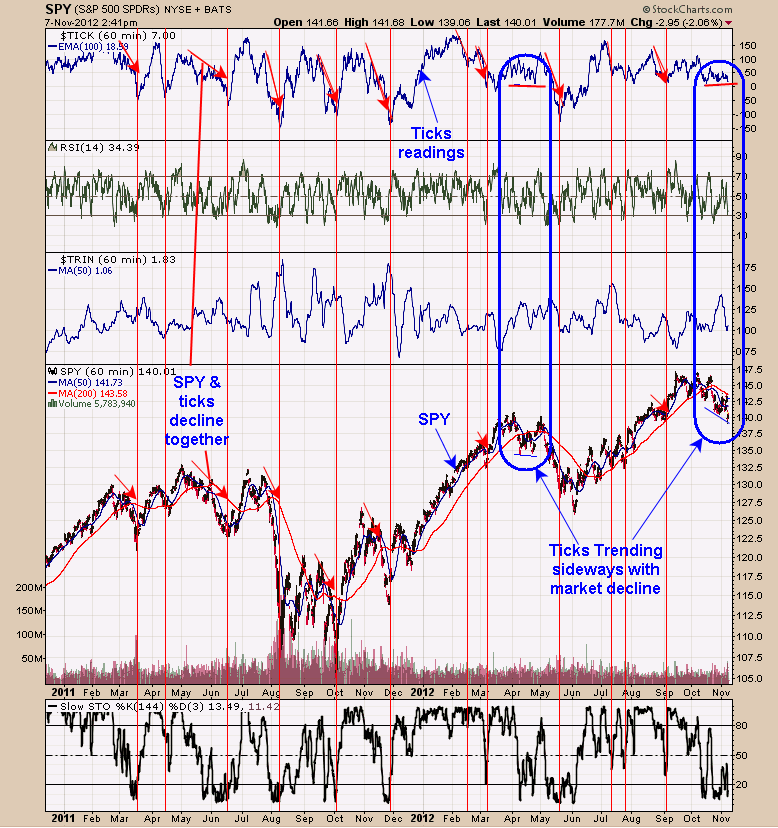
The top window in the chart above is the hourly tick reading with a 100 period moving average. In general the tick readings rise and fall with the SPY and help to confirm the SPY trend. With the sideways to down in the SPY over the past week, one would expect the tick readings to be pushing down. However, that is not the case as tick readings have been moving sideways in that time frame similar to what happen back at the April low.
In previous declines in the SPY the Tick readings declined and help confirm one another. With the ticks readings holding steady it would imply another rally is coming for the SPY. Today’s decline in the SPY may be the disappointment of the election and tomorrow trading could be more representative of what the market attends to do.
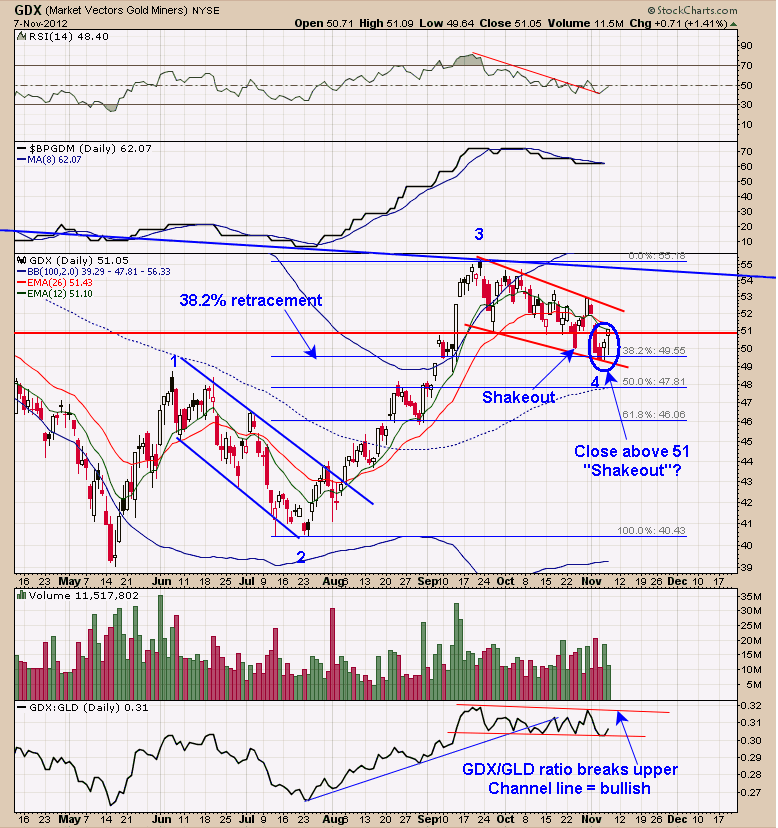
Above is the daily GDX chart. Over the past 7 weeks, GDX have been building “Cause” for the next move in an Elliott Wave 4 correction. On October 24 a Shakeout day formed and a bullish sign and suggested that Wave 5 up may have started. The market did go up a couple of days and came right back down. Over the last couple of days another bullish “Shakeout” formed as GDX closed above 51 and suggests again Wave 5 may be starting. The bottom chart is the GDX/GLD ratio.
A close above the upper boundary line near .32 would suggest Wave 5 is under way. Once Wave 5 has started its capable of reaching the upper 60’s range. The monthly XAU charts remain on buy signals and Seasonality remains bullish for November. Long NG at 5.14 on 10/8/12. Long GDX 58.65 on 12/6/11. Long SLV at 29.48 on 10/20/11. Long GDXJ average 29.75 on 4/27/12. Long GLD at 173.59 on 9/21/11.
Long BRD at 1.67 on 8/3/11. Long YNGFF .44 on 7/6/11. Long EGI at 2.16, on 6/30/11. Long GLD at 147.14 on 6/29/11; stop 170 hit = gain 15.5% . Long KBX at 1.13 on 11/9/10. Long LODE at 2.85 on 1/21/11. Long UEXCF at 2.07 on 1/5/11. We will hold as our core position in AUQ, CDE and KGC because in the longer term view these issues will head much higher. Holding CDE (average long at 27.7. Long cryxf at 1.82 on 2/5/08. KGC long at 6.07. Long AUQ average of 8.25.
