Last week’s review of the macro market indicators (abbreviated) suggested, as we headed into the dog days of August, that the market trend was firmly higher but consolidation was reigning. We looked for Gold (GLD) to continue to bounce in its downtrend while Crude Oil (USO) consolidated in its breakout higher. The US Dollar Index (UUP) looked set to continue lower while US Treasuries (TLT) bounced in the downtrend. The Shanghai Composite (SSEC) and Emerging Markets (EEM) were poised to consolidate in their bounces in the downtrend while Volatility (VIX) looked to remain low. This kept the bias higher for the equity index ETFs S&P 500 (SPY), Russell 2000 (IWM) and Nasdaq (QQQ), but their charts suggested consolidation may continue.
The week played out with Gold ripping higher late in the week while Crude Oil also moved up, but more slowly. The US Dollar drifted up before it broke lower while Treasuries just kept falling. The Shanghai Composite found a top and pulled back while Emerging Markets played similarly. Volatility bounced off of the lows but remained subdued. The Equity Index ETF’s drifted early before selling off late in the week and closing near the lows. What does this mean for the coming week? Lets look at some charts:
SPY Daily, SPY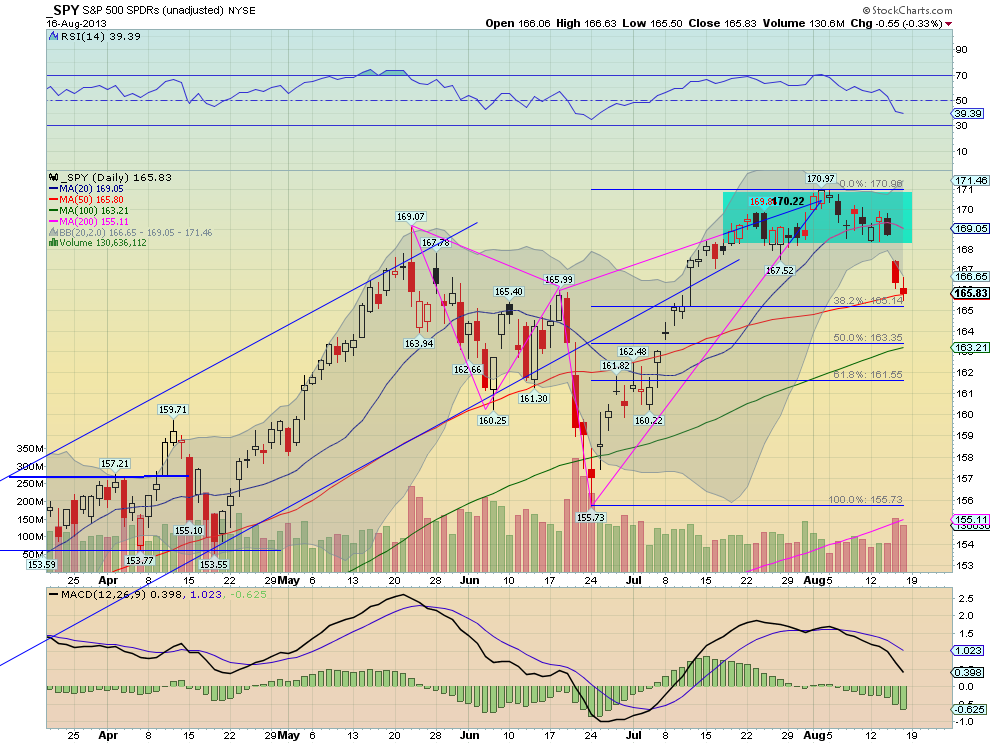
SPY Weekly, SPY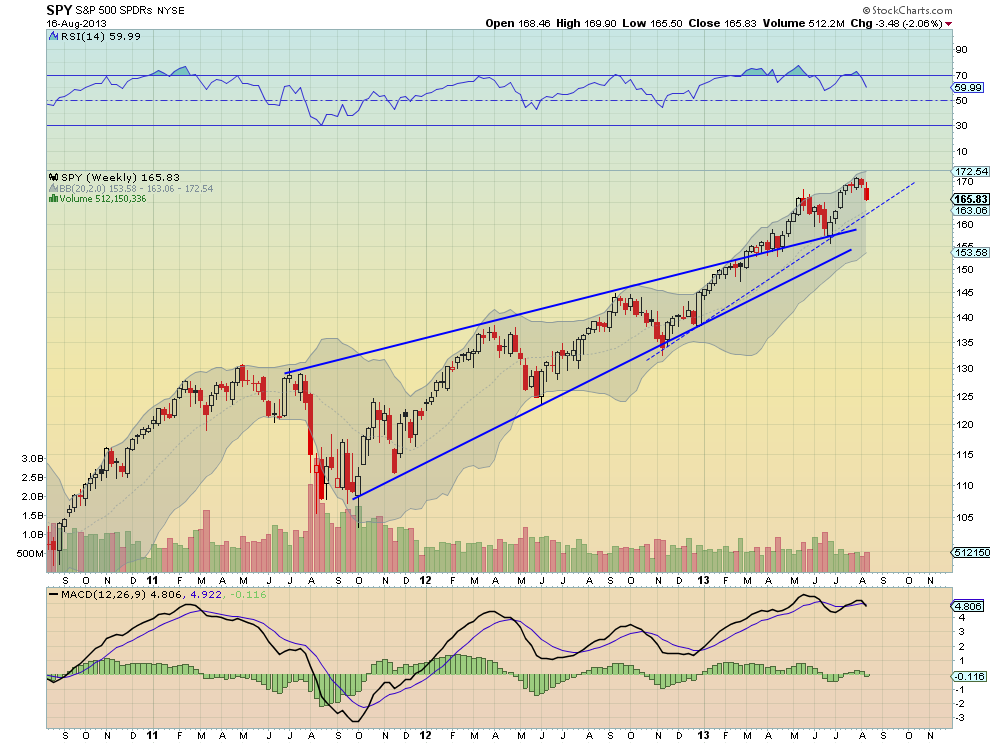
The SPY moved lower towards the first target of the bearish Shark this week at 165.14. It finished the week at the 50 day Simple Moving Average (SMA) and many will look at that as a buy point. The Relative Strength Index (RSI) on the daily chart though is falling and just moved into bearish territory under 40 with a Moving Average Convergence Divergence indicator (MACD) that is running lower, both supporting more downside. Out on the weekly chart there is a similar view. The price has now pulled back to the previous high so it could be a good reversal spot, but there is trend support lower near 163, which would coincide with the 100 day SMA on the daily chart. The RSI on this timeframe is pulling back but in bullish territory with a MACD that is looking lower after a bearish cross down. Support lower comes at 165 and 163.30 followed by 161. Things do not get really bearish until it moves under 155.73. Resistance on a bounce comes first at 167.50 and then 168 and a gap fill to 168.70, with 169 and 169.85 above that. Continued Downside in the Uptrend.
Starting the September options cycle the equity markets look weak and heavy. Look for Gold to continue to rise in the downtrend while Crude Oil just chugs higher. The US Dollar Index seems poised to move lower along with US Treasuries. The Shanghai Composite and Emerging Markets are biased to continue to the downside with risk of the Emerging Markets consolidating first. Volatility looks to remain low keeping the bias higher for the equity index ETF’s SPY, IWM and QQQ, but their charts suggest more pullback. The QQQ is the strongest of the bunch and may just consolidate. Use this information as you prepare for the coming week and trad’em well.
Disclosure: The information in this blog post represents my own opinions and does not contain a recommendation for any particular security or investment. I or my affiliates may hold positions or other interests in securities mentioned in the Blog, please see my Disclaimer page for my full disclaimer.
Original post
- English (UK)
- English (India)
- English (Canada)
- English (Australia)
- English (South Africa)
- English (Philippines)
- English (Nigeria)
- Deutsch
- Español (España)
- Español (México)
- Français
- Italiano
- Nederlands
- Português (Portugal)
- Polski
- Português (Brasil)
- Русский
- Türkçe
- العربية
- Ελληνικά
- Svenska
- Suomi
- עברית
- 日本語
- 한국어
- 简体中文
- 繁體中文
- Bahasa Indonesia
- Bahasa Melayu
- ไทย
- Tiếng Việt
- हिंदी
SPY Overview: Trend Higher But Consolidation Reigning
Published 08/18/2013, 02:15 AM
Updated 05/14/2017, 06:45 AM
SPY Overview: Trend Higher But Consolidation Reigning
Latest comments
Loading next article…
Install Our App
Risk Disclosure: Trading in financial instruments and/or cryptocurrencies involves high risks including the risk of losing some, or all, of your investment amount, and may not be suitable for all investors. Prices of cryptocurrencies are extremely volatile and may be affected by external factors such as financial, regulatory or political events. Trading on margin increases the financial risks.
Before deciding to trade in financial instrument or cryptocurrencies you should be fully informed of the risks and costs associated with trading the financial markets, carefully consider your investment objectives, level of experience, and risk appetite, and seek professional advice where needed.
Fusion Media would like to remind you that the data contained in this website is not necessarily real-time nor accurate. The data and prices on the website are not necessarily provided by any market or exchange, but may be provided by market makers, and so prices may not be accurate and may differ from the actual price at any given market, meaning prices are indicative and not appropriate for trading purposes. Fusion Media and any provider of the data contained in this website will not accept liability for any loss or damage as a result of your trading, or your reliance on the information contained within this website.
It is prohibited to use, store, reproduce, display, modify, transmit or distribute the data contained in this website without the explicit prior written permission of Fusion Media and/or the data provider. All intellectual property rights are reserved by the providers and/or the exchange providing the data contained in this website.
Fusion Media may be compensated by the advertisers that appear on the website, based on your interaction with the advertisements or advertisers.
© 2007-2025 - Fusion Media Limited. All Rights Reserved.