SPY Megaphones: Appears Like Distribution

Published 01/07/2015, 01:33 AM
Updated 07/09/2023, 06:31 AM

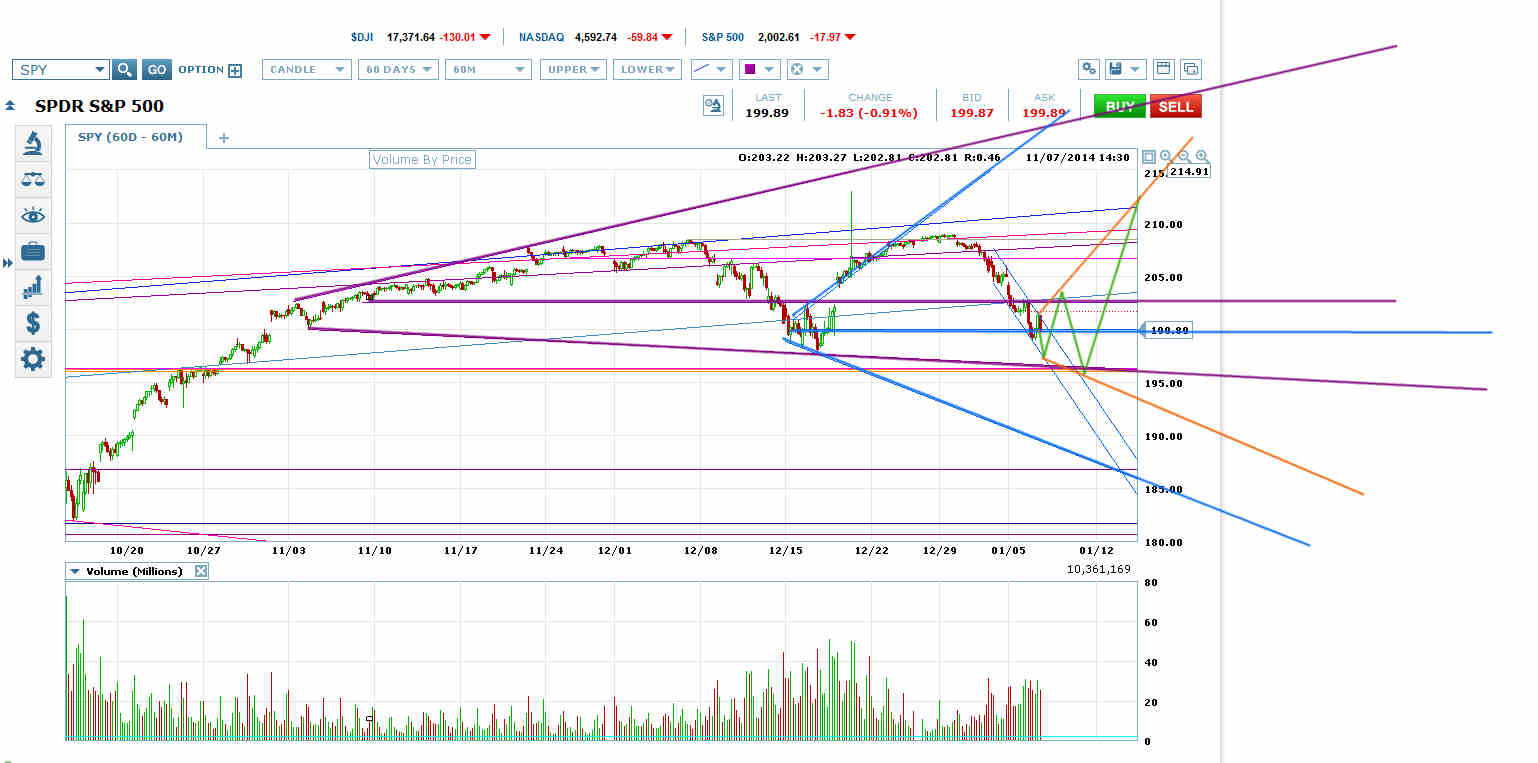
SPY Chart From October 2014-To Present

The SPY chart is a little clearer than ES at the moment, so briefly here is what it’s saying.

SPY has essentially formed a price channel (blue on chart) down to the VWAP of its bright blue bottoming megaphone from mid-December. That price channel reached its critical decision point and failed to break out downwards into a steeper melt-down channel. That suggests SPY has started forming a new megaphone across that VWAP (green scenario).

What’s happening is that the market keeps breaking the price out to slightly new highs that get heavily sold into. That’s distribution. Then the sellers lay off a little below the SPY 200 level and a megaphone starts forming that takes the price to another new high for them to sell into.

Sooner or later one of these megaphones at SPY 200 will break out downwards. It’s even possible that this one will, but I think the market’s got enough juice for another move up.

A downward breakout from a megaphone across the bright blue megaphone VWAP would target the bright blue megaphone bottom, which would be down near the October 15 low if SPY headed down there now.

Latest comments

Loading next article…
Risk Disclosure: Trading in financial instruments and/or cryptocurrencies involves high risks including the risk of losing some, or all, of your investment amount, and may not be suitable for all investors. Prices of cryptocurrencies are extremely volatile and may be affected by external factors such as financial, regulatory or political events. Trading on margin increases the financial risks.
Before deciding to trade in financial instrument or cryptocurrencies you should be fully informed of the risks and costs associated with trading the financial markets, carefully consider your investment objectives, level of experience, and risk appetite, and seek professional advice where needed.
Fusion Media would like to remind you that the data contained in this website is not necessarily real-time nor accurate. The data and prices on the website are not necessarily provided by any market or exchange, but may be provided by market makers, and so prices may not be accurate and may differ from the actual price at any given market, meaning prices are indicative and not appropriate for trading purposes. Fusion Media and any provider of the data contained in this website will not accept liability for any loss or damage as a result of your trading, or your reliance on the information contained within this website.
It is prohibited to use, store, reproduce, display, modify, transmit or distribute the data contained in this website without the explicit prior written permission of Fusion Media and/or the data provider. All intellectual property rights are reserved by the providers and/or the exchange providing the data contained in this website.
Fusion Media may be compensated by the advertisers that appear on the website, based on your interaction with the advertisements or advertisers.
© 2007-2025 - Fusion Media Limited. All Rights Reserved.