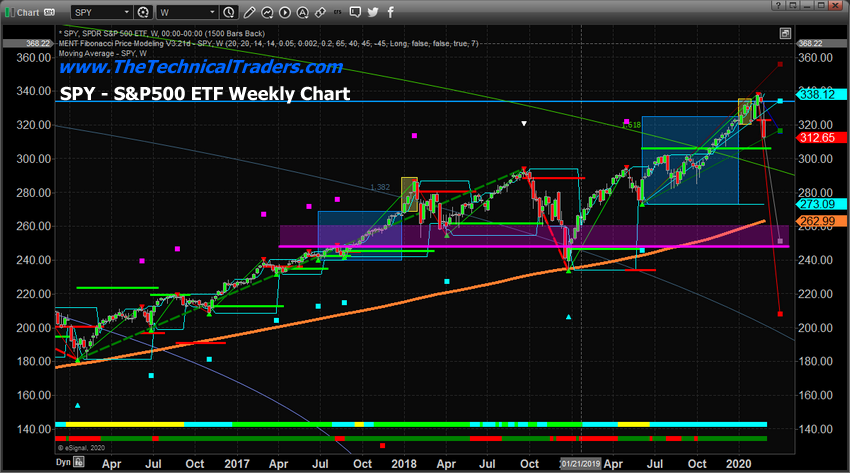
Our research team wanted to share this chart with our friends and followers. This dramatic breakdown in price over the past 4+ days has resulted in a very clear bearish trigger which was confirmed by our Adaptive Fibonacci Price Modeling system. We believe this downside move will target the $251 level on the SPY (NYSE:SPY) over the next few weeks and months.
Some recent headline articles worth reading:
On January 23, 2020, we issued a warning that the Put/Call ratio was warning of a potential Flash Crash
On January 24, 2020, we issued a research post related to the Wuhan Wipeout the markets
On January 26, 2020, we issued this research post about the start of a Black Swan event
On January 29, 2020, we issued this research post about a potential WaterFall selloff
Clearly, we were well ahead of this correction and issued multiple warnings to our friends and followers. This week we locked in 9.48% on GDXJ at the open on Monday, and today we are writing to suggest that $251 on the SPY (NYSE:SPY) is real support (see the magenta/purple area/line on this chart) and pay attention to the real risks at play in the markets.

This would suggest that the major markets will wipe out about 25% of the valuations in the major averages (ES, NQ, and YM), before finding any real support. Obviously, there is a level near $208 that appears in RED on this chart. If $251 fails to hold as support, then we immediately start to look at that $208 level for ultimate support.
This is the time when you want skilled researchers and traders backing you up and sourcing real solid trade opportunities for you. We’ve been warning about this move for many months, suggesting that 2020 was going to be an incredible year for skilled traders and warning that a large downside price rotation was likely after August 2019.
