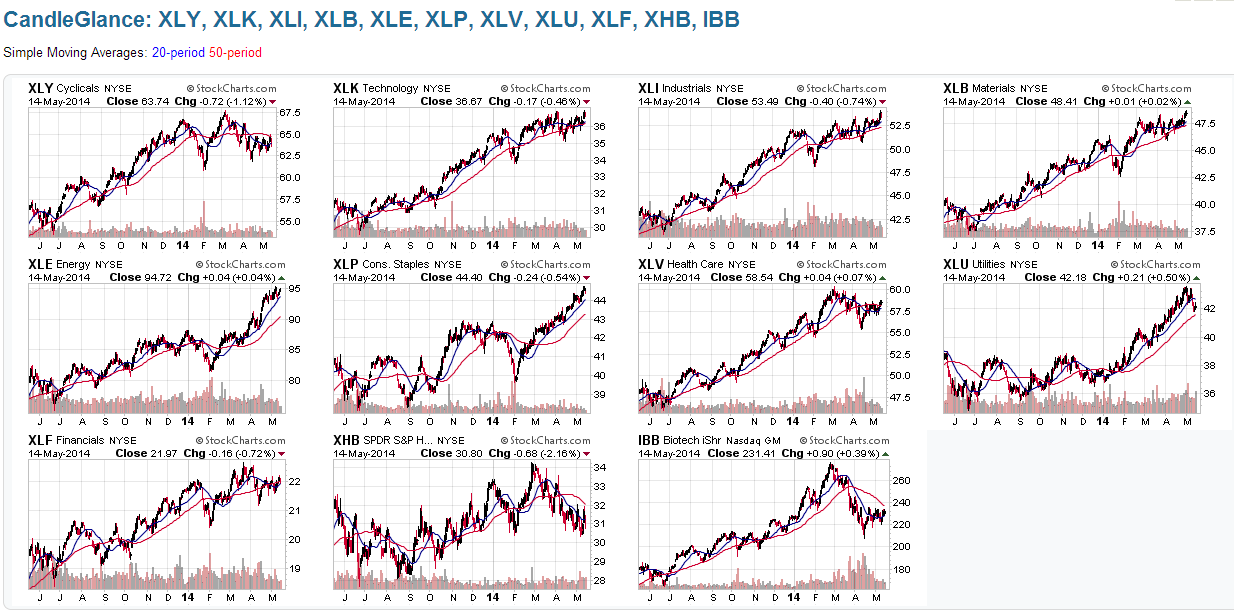
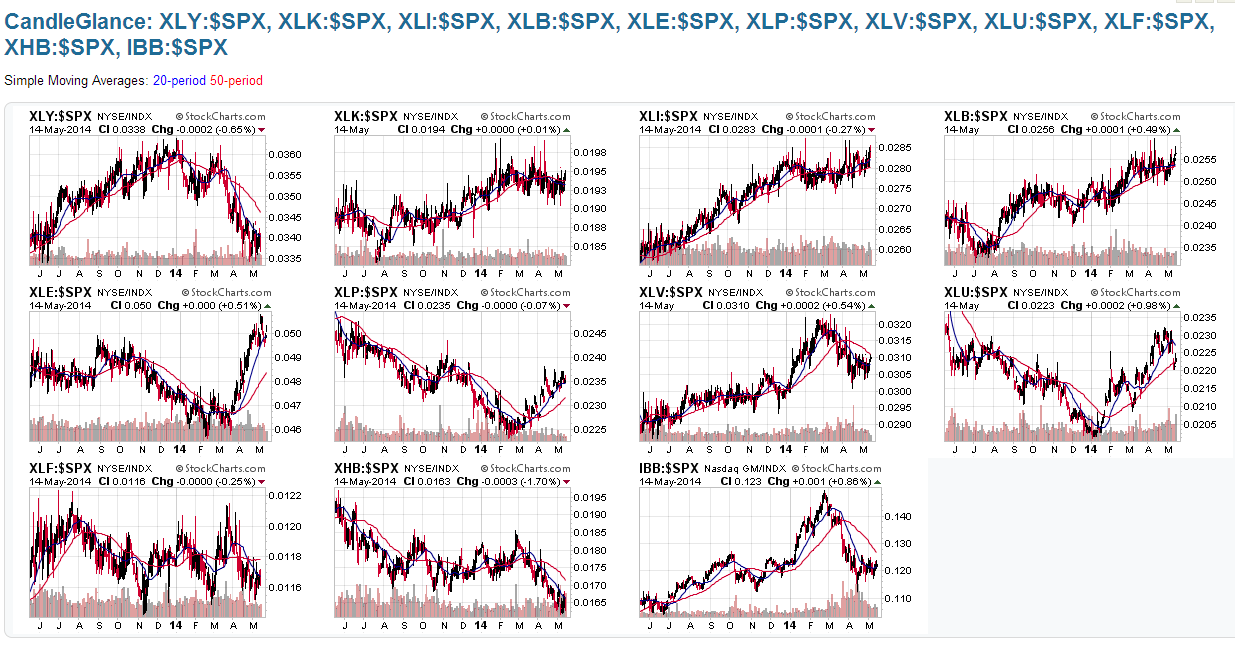
The following 11 1-Year Daily charts show the 9 Major Sectors, plus Housing and Biotech.
You can see that Technology (SPDR Select Sector - Technology (NYSE:XLK)), Industrials (Industrial Sector SPDR Trust (ARCA:XLI)), Materials (SPDR Materials Select Sector (ARCA:XLB)), Energy (SPDR Energy Select Sector Fund (ARCA:XLE)), and Consumer Staples (SPDR - Consumer Staples (ARCA:XLP)) have been the strongest performers, of late. The laggards have been Housing (SPDR S&P Homebuilders (NYSE:XHB)) and Biotech (iShares Nasdaq Biotech (NASDAQ:IBB))
What I notice immediately on these is the relative weakness of Cyclicals (XLY), Financials (XLF), and Housing (XHB), followed by Biotech (IBB). Unless we see a firming up and buying begins in these 4 sectors, we may see a general weakness creep into the stock market, in general...which is something worth watching going forward.
The accumulation we've seen in 2-5-10-30-year bonds of late, and particularly yesterday (Wednesday), may be an attempt by the institutions/market makers to lower interest rates as a precursor to, potentially, stimulate buying in these sectors...so, bonds/rates are also worth tracking over the next weeks/months, relative to these and all sectors...see Sectors vs 30-year bond ratio charts here.


