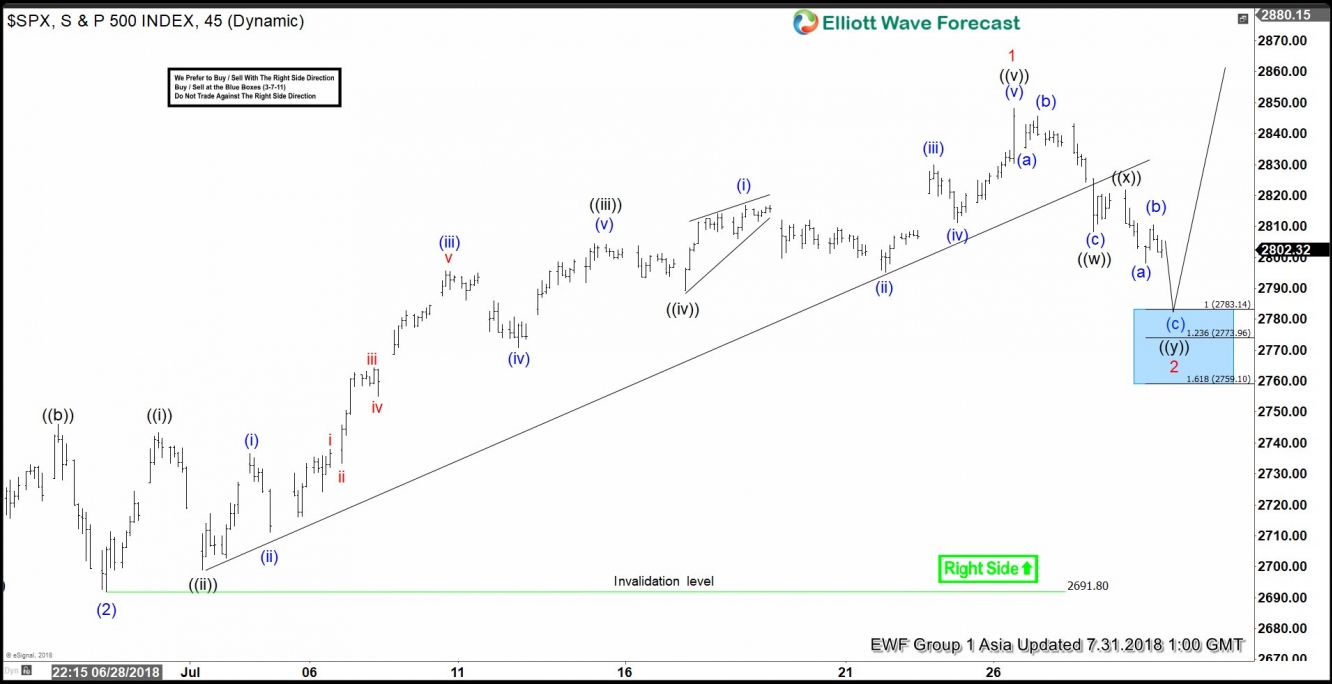
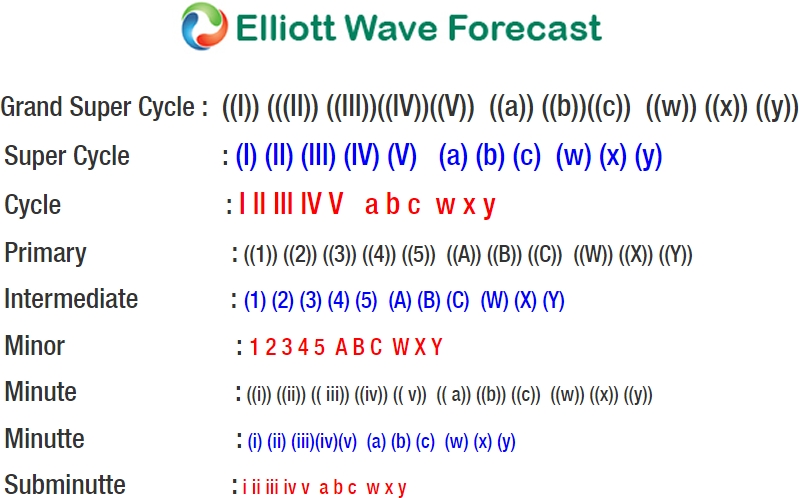
SPX Short-term Elliott Wave analysis suggests that the pullback to $2691.80 low on 6.28.2018 ended intermediate wave (2). Above from there, the rally higher to $2848.03 peak ended Minor wave 1. The internals of that rally higher took the form as impulse Elliott wave structure where Minute wave ((i)), ((ii)) & ((iii)) unfolded in 5 waves structure & wave ((ii)) & ((iv)) unfolded in 3 swings corrective sequence.
Up from $2691.8 low, the rally higher to $2743.26 high ended Minute wave ((i)) in 5 waves. The pullback to $2698.95 ended Minute wave ((ii)) and the rally higher to $2804.53 high ended Minute wave ((iii)) as 5 wave structure. From there, Minute wave ((iv)) pullback ended at $2789.24 low and the rally higher to $2848.03 peak ended Minute wave ((v)) which also completed Minor wave 1.
The Index is now correcting cycle from 6.28.2018 low within wave 2 in 3, 7 or 11 swings before further upside is seen. Near-term focus remains towards $2783.14-$2759.10, which is 100%-161.8% Fibonacci extension area of ((w))-((x)) to end the 3 swings pullback in Minor wave 2. Buyers should appear from the above area either for new highs or for 3 waves reaction higher at least. We don’t like selling it.
SPX 1 Hour Elliott Wave Chart


