This is the institutional way to say, Sell in May and go away, and in looking at the handsome gains in some of the so-called bull market sectors in the context of reversing uptrends, it probably makes sense to start taking profits in those segments and reallocating to some of the more defensive sectors and/or sit the summer out on the sidelines in cash.
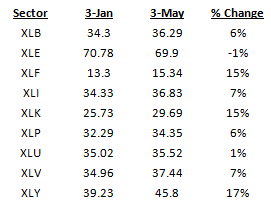
As shown above, the financials, technology and consumer discretionary sectors, and three of true offensive bull market sectors, are up 15% to 17% year-to-date even as three of the other bull market sectors, energy, basic materials and the industrials, are showing a -1% to 7% change year-to-date. Put another way, energy is leading what appears to be a reversal in the so-called bull market sectors with the materials and the industrials not too far behind.
This year-to-date decline in the energy sector sends not only a powerful message about the probably poor economic growth prospects for 2013, but it is telling investors to take profits in the bull market sectors not yet affected too much by an overall market reversal of the Operation Twist LTRO rally and this means reduce exposure to the financials, technology and consumer discretionary in favor of cash or perhaps some of the so-called bear market sectors if equity exposure is needed. 
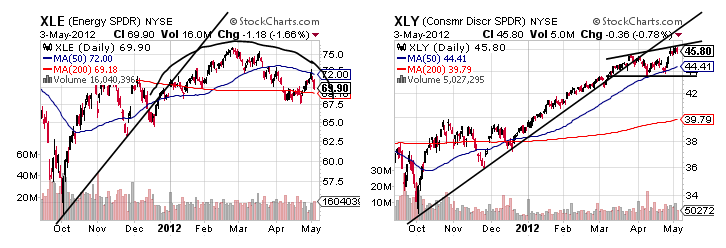
In looking at the charts of the XLE, and the bull sector that is down 1% on the year and leading an apparent reversal of these sectors and probably the broader market too, and the XLY, and the bull market sector with the biggest YTD gains, it is pretty clear the XLE started to reverse its intermediate-term uptrend late last year with this sector less affected by the LTRO love while the XLY only just started to reverse that same uptrend one month ago.
It seems that the intermediate-term reversal message of the XLE should be heeded with a likely Death Cross on the way as the XLE appears vulnerable to a Complex Head and Shoulders pattern marked in by the dome above that should take the XLE down to about $60 with an unmarked Rising Wedge of sorts suggesting the XLE may fall by 20% from current levels and a drop that could be closer to 30% for the XLY.
This sort of a 30% decline seems likely for the XLF and the XLK, too, on the combination of topping patterns perched on bearish Rising Wedges and thus a sidelines stance around all of the bull market sectors appears to make sense moving through spring into summer.
Unfortunately, these sorts of potential declines in the bull market sectors are likely to reflect an overall market pullback on the same pattern combination and so unless overall exposure to the equity markets is required, it may be smart to sit on the sidelines during what may be a volatile sideways trend up and down and similar to last year before a big break down or simply that big break down. However, the so-called bear market sectors such as healthcare and the utilities with telecom not included in this work, where it seems that the XLU and XLV are more likely to drop by 10-15% rather than the 20-30% that seems more likely for the bull market sectors. 
There is even the chance that the XLU and the XLV make slight gains in the weeks or months ahead in judging by the Ascending Trend Channels above and aspects that support both of these sectors nicely even in the time of market disruption to the downside.
It is that sort of buffering from a potential sell in May and go away market drop in the defensive sectors that supports the bull market sector message of energy’s reversal and all of this seems to suggest that a spring/summer sector rotation is on the way.
- English (UK)
- English (India)
- English (Canada)
- English (Australia)
- English (South Africa)
- English (Philippines)
- English (Nigeria)
- Deutsch
- Español (España)
- Español (México)
- Français
- Italiano
- Nederlands
- Português (Portugal)
- Polski
- Português (Brasil)
- Русский
- Türkçe
- العربية
- Ελληνικά
- Svenska
- Suomi
- עברית
- 日本語
- 한국어
- 简体中文
- 繁體中文
- Bahasa Indonesia
- Bahasa Melayu
- ไทย
- Tiếng Việt
- हिंदी
Spring/Summer Sector Rotation Time?
Latest comments
Loading next article…
Install Our App
Risk Disclosure: Trading in financial instruments and/or cryptocurrencies involves high risks including the risk of losing some, or all, of your investment amount, and may not be suitable for all investors. Prices of cryptocurrencies are extremely volatile and may be affected by external factors such as financial, regulatory or political events. Trading on margin increases the financial risks.
Before deciding to trade in financial instrument or cryptocurrencies you should be fully informed of the risks and costs associated with trading the financial markets, carefully consider your investment objectives, level of experience, and risk appetite, and seek professional advice where needed.
Fusion Media would like to remind you that the data contained in this website is not necessarily real-time nor accurate. The data and prices on the website are not necessarily provided by any market or exchange, but may be provided by market makers, and so prices may not be accurate and may differ from the actual price at any given market, meaning prices are indicative and not appropriate for trading purposes. Fusion Media and any provider of the data contained in this website will not accept liability for any loss or damage as a result of your trading, or your reliance on the information contained within this website.
It is prohibited to use, store, reproduce, display, modify, transmit or distribute the data contained in this website without the explicit prior written permission of Fusion Media and/or the data provider. All intellectual property rights are reserved by the providers and/or the exchange providing the data contained in this website.
Fusion Media may be compensated by the advertisers that appear on the website, based on your interaction with the advertisements or advertisers.
© 2007-2025 - Fusion Media Limited. All Rights Reserved.
