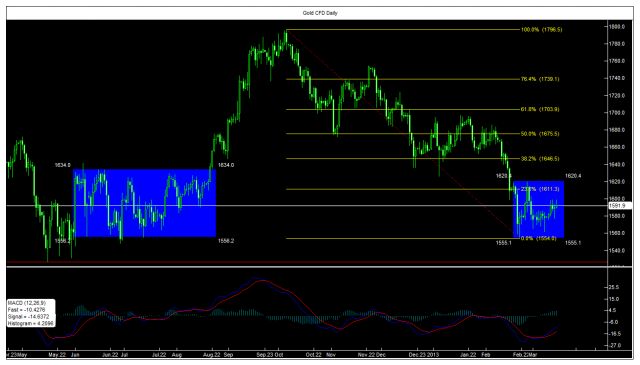
After registering low at 1554, the yellow metal seem to be crawling at a snail pace back to upside. If you look at the candles, one by one, you’ll notice that there’s isn't a single day where the buyers and sellers can really claim the throne.
The yellow metal is trying to find its base or technically, a strong support. Historically, the buyers should have found it by now.
From early June to late August 2012 , gold had been stabilizing itself in the same fashioned way. It found a support (1556) and resistance (1634) zone inside the blue rectangle box. A breakout from the box was accompanied by a long white candlestick and an upside move of the MACD.
I wouldn't be surprised if the current price would take the same action. The buyers should find the current low (1554) interesting enough to add to their position. A ceiling of 1620/1625 should provide the resistance; although they have to break the psycho level 1600 and fibo 23.6% first.
The main question for now is, can gold break more to the downside? Can it actually break the current base and hit a new low? I woukld let the answer come from 1) the equity market; namely the DJIA and 2) the March FOMC meeting.
- English (UK)
- English (India)
- English (Canada)
- English (Australia)
- English (South Africa)
- English (Philippines)
- English (Nigeria)
- Deutsch
- Español (España)
- Español (México)
- Français
- Italiano
- Nederlands
- Português (Portugal)
- Polski
- Português (Brasil)
- Русский
- Türkçe
- العربية
- Ελληνικά
- Svenska
- Suomi
- עברית
- 日本語
- 한국어
- 简体中文
- 繁體中文
- Bahasa Indonesia
- Bahasa Melayu
- ไทย
- Tiếng Việt
- हिंदी
Spot Gold: Stabilizing And Finding A Base
Published 03/18/2013, 07:25 AM
Updated 05/14/2017, 06:45 AM
Spot Gold: Stabilizing And Finding A Base
Latest comments
Loading next article…
Install Our App
Risk Disclosure: Trading in financial instruments and/or cryptocurrencies involves high risks including the risk of losing some, or all, of your investment amount, and may not be suitable for all investors. Prices of cryptocurrencies are extremely volatile and may be affected by external factors such as financial, regulatory or political events. Trading on margin increases the financial risks.
Before deciding to trade in financial instrument or cryptocurrencies you should be fully informed of the risks and costs associated with trading the financial markets, carefully consider your investment objectives, level of experience, and risk appetite, and seek professional advice where needed.
Fusion Media would like to remind you that the data contained in this website is not necessarily real-time nor accurate. The data and prices on the website are not necessarily provided by any market or exchange, but may be provided by market makers, and so prices may not be accurate and may differ from the actual price at any given market, meaning prices are indicative and not appropriate for trading purposes. Fusion Media and any provider of the data contained in this website will not accept liability for any loss or damage as a result of your trading, or your reliance on the information contained within this website.
It is prohibited to use, store, reproduce, display, modify, transmit or distribute the data contained in this website without the explicit prior written permission of Fusion Media and/or the data provider. All intellectual property rights are reserved by the providers and/or the exchange providing the data contained in this website.
Fusion Media may be compensated by the advertisers that appear on the website, based on your interaction with the advertisements or advertisers.
© 2007-2025 - Fusion Media Limited. All Rights Reserved.
