A bottom for the British pound just got more likely. The latest data from the CFTC shows that net speculators beat a major retreat from net short positions against the British pound: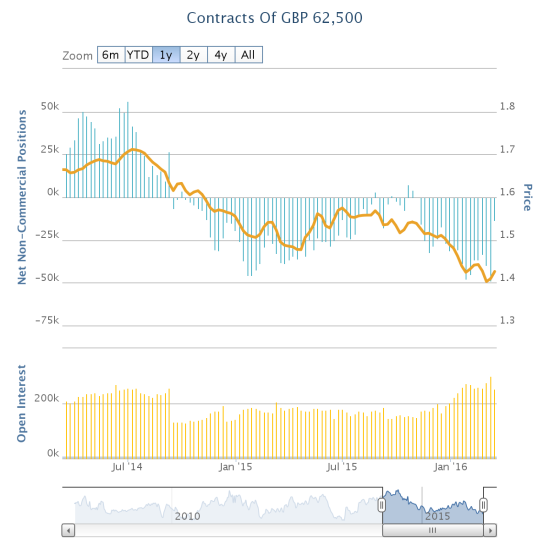
Bearish sentiment is suddenly in major retreat on the British pound (NYSE:FXB)
The chart shows that speculators have not held such small net short positions since the surge began in early November. I consider this change significant enough to assume that the British pound has printed a bottom for now. I addressed other catalysts last week in “The British Pound Finally Attempts A Comeback.” Accordingly, I doubt another pound-specific catalyst strong enough to break recent lows will arrive before the June 23rd referendum on the UK’s membership in the European Union (EU). I am particularly referring to the bottom holding against the U.S. dollar.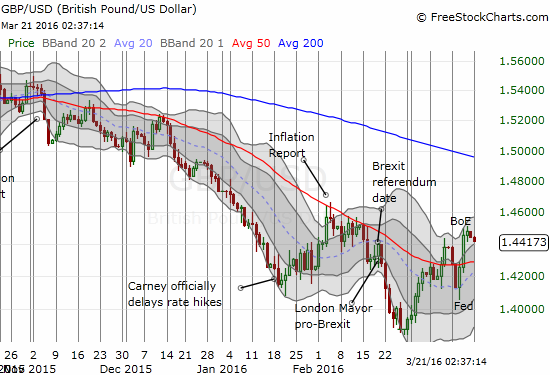
Speculators may have confirmed the 50-day moving average (DMA) breakout for GBP/USD.
Of course, a revival in policy divergence or a major reversal in tone from the Fed could send the dollar soaring again, but I am expecting neither. In fact, the U.S. dollar index is breaking down from its 200-day moving average (DMA).
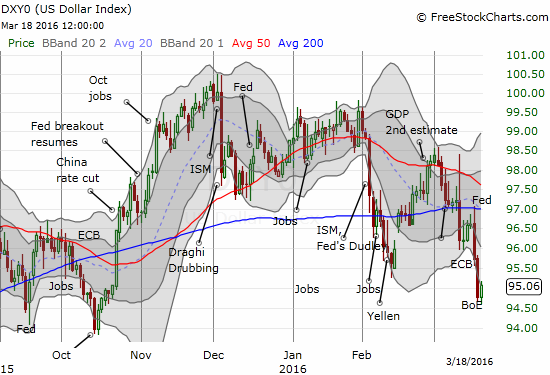
The U.S. dollar index is breaking down. It now sits at a 5-month low.
The yen’s strength may become sufficient to break the recent low. However, if GBP/JPY also manages a 50DMA breakout, I will quickly drop my short on this pair.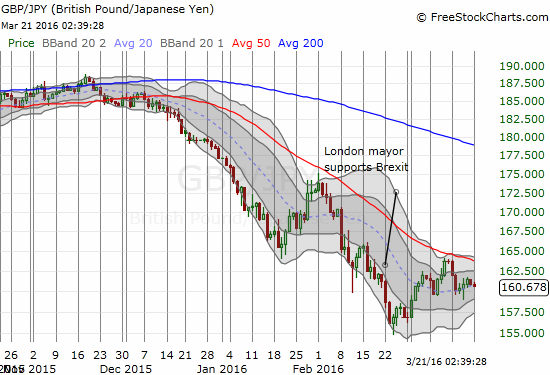
GBP/JPY continues to linger under 50DMA resistance.
The latest CFTC report included some other big moves:
- Speculators significantly trimmed net longs on the Australian dollar (NYSE:FXA). I am now looking for the Aussie’s recent momentum to wane. It will not likely reverse until speculators get bearish again.
- Net shorts against the Canadian dollar (NYSE:FXC) fell for the seventh week in a row.
- Net shorts against the euro (NYSE:FXE) increased for the third week in a row.
- Net longs on the Japanese yen (NYSE:FXY) fell for the first time since February 1, 2016
- Net longs have gone notably positive on the Swiss franc (NYSE:FXF) for the the first time since January 18, 2016
The combination of less bearish pound speculators and less bullish Aussie speculators could signal an imminent end to one of the best gravy trains in forex right now: the relentless downtrend on GBP/AUD from the September multi-year high…
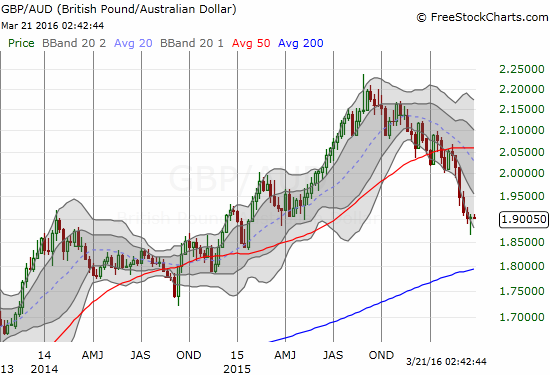
This weekly chart shows a relentless downtrend for GBP/AUD that accelerated in late February. However, last week’s “hammer” pattern looks eerily similar to the hammer that marked a short-term bottom just about one year ago….
Be careful out there!
Full disclosure: long FXC; in forex, I am short GBP/JPY and GBP/AUD. I also have various long and short positions on currency pairs involving the above-mentioned currencies.
