The Next Big Move Depends on How Exactly ES Takes Out the August 24 Low
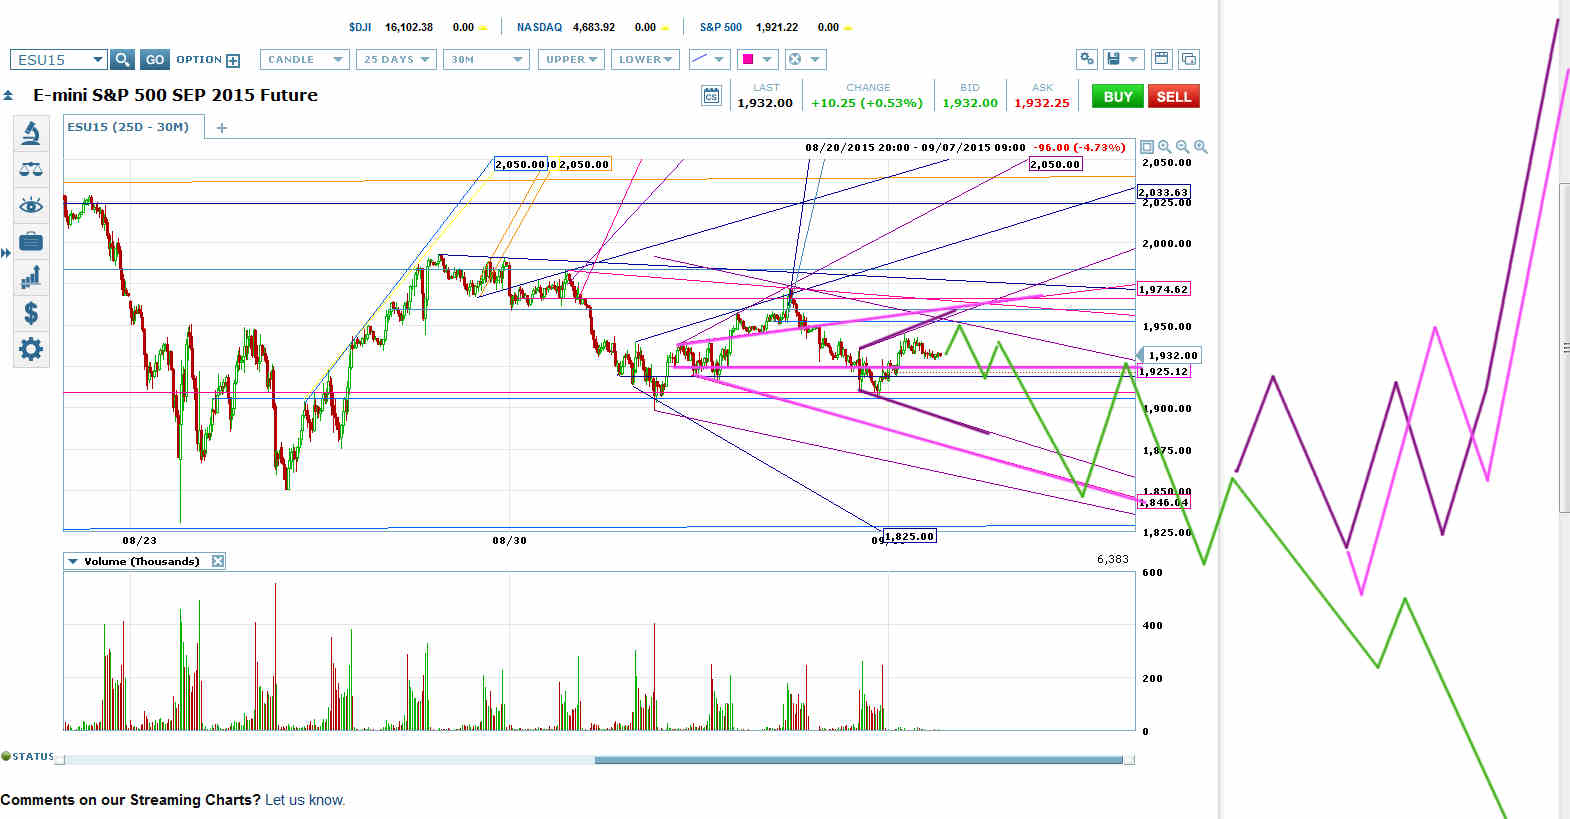
ES is Forming a Labor Day Megaphone (Purple) Across its Pink Megaphone VWAP
ES is instead a Labor Day megaphone across VWAP of the pink megaphone on the chart. This was always an alternative and doesn’t affect anything longer-term.
I’ve drawn both the bearish and bullish longer-term set-ups on the chart. The purple and pink scenarios would likely put in a very small bottoming pattern down near the August 24 low. If you see something like that breaking out upwards, rather than the green scenario’s quick pop and drop, it’s a set-up to get long lower down.
The green scenario is a price channel melt-down scenario. The purple and pink scenarios represent ES taking out the August 24 low, but not by much and not for long. The target after that pierce of the August 24 low would depend on how exactly that lower low plays out.
Set-Up for a Giant Megaphone Right Shoulder
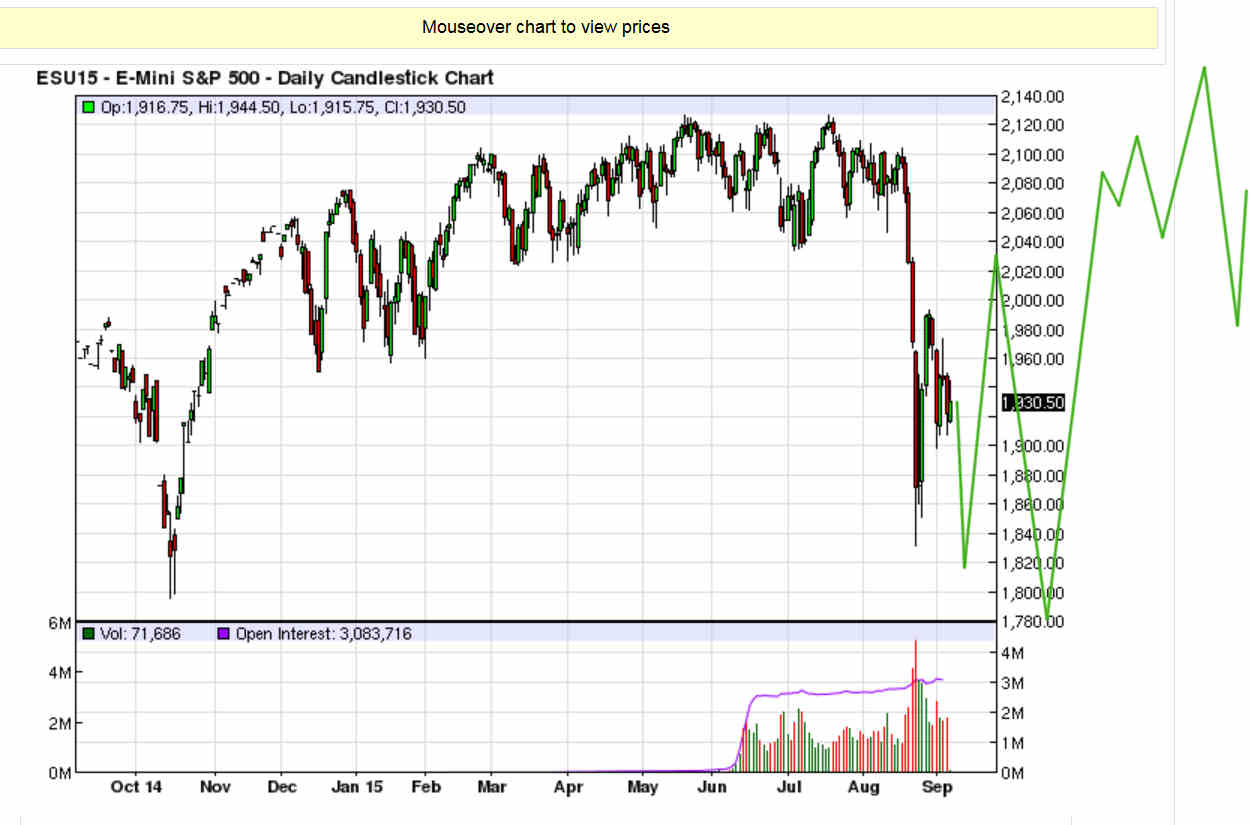
For example, if ES puts in a small pierce of the August 24 low, but fails to take out the April and October 2014 lows, a megaphone right shoulder would likely be forming on the big H&S on the daily chart. That would likely mean a surge to past the August 28th high, then a drop to a new low, then another surge to a new right shoulder high.
Megaphone right shoulders usually lead to a squeaker new high for a new head on a larger H&S.
If ES Takes Out the August 24 Low but Not the October 2014 Low, a Megaphone Right Shoulder Would Be Likely
Often in this scenario, ES would take out the August 24 low but NYSE:SPY would not.
Set-Up for a Melt-Up to a New All-Time High and a Top that Takes Forever
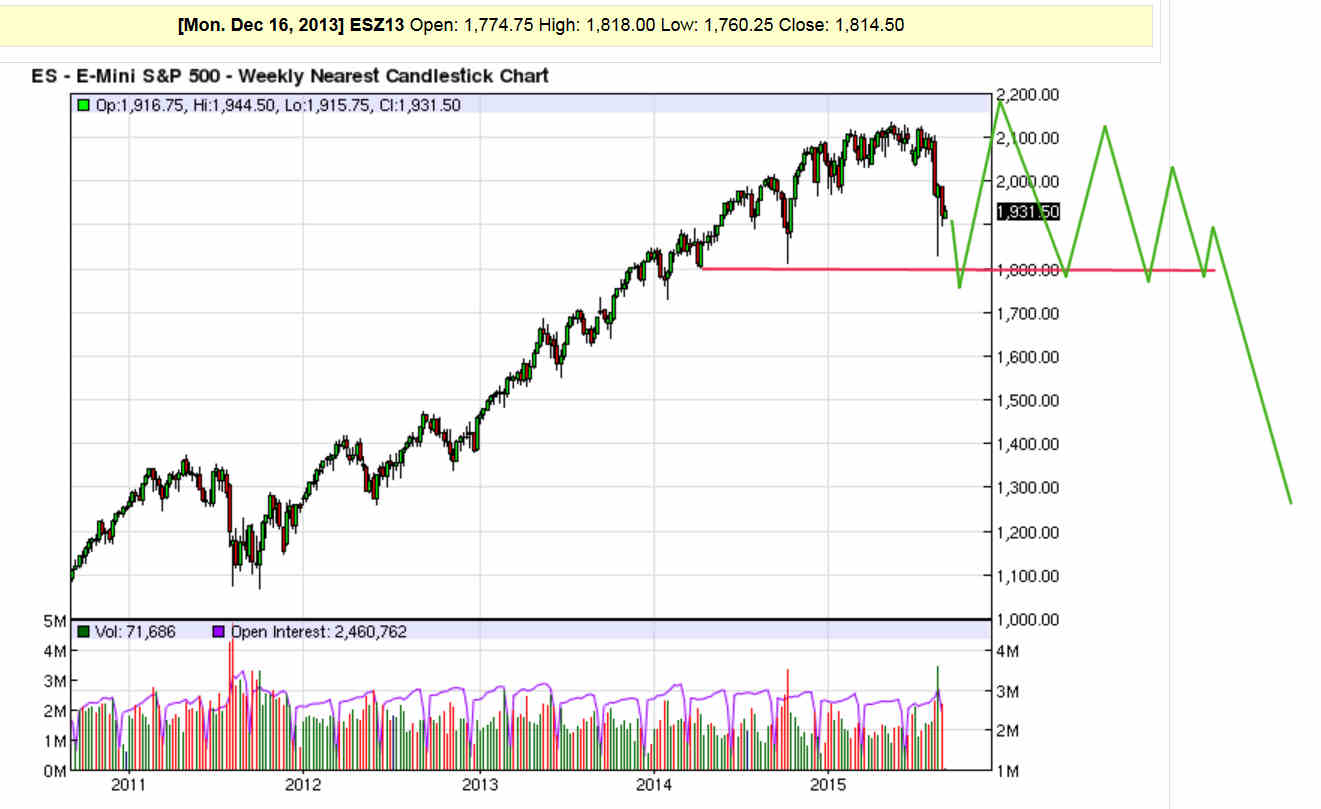
If ES takes out the August 24 low, plus the April and October 2014 lows, but fails to drop 5% from the April 2014 low before reentering the H&S neckline, we’d have a flat-bottomed ascending-top megaphone failure. The target for that would be a new all-time high, but probably in a melt-up rather than a megaphone right shoulder.
That kind of surge would put a new head on a bigger, more complex head and shoulders top. The right side of the formation would usually mirror the left, which means that the market would be trying to top for roughly forever.
If ES Takes Out the April and October 2014 Lows, but Fails to Drop 5% Before Reentering the H&S Neckline, We’ll Likely See a New High and Prolonged Topping Action
Set-Up for a Giant Triangle Right Shoulder
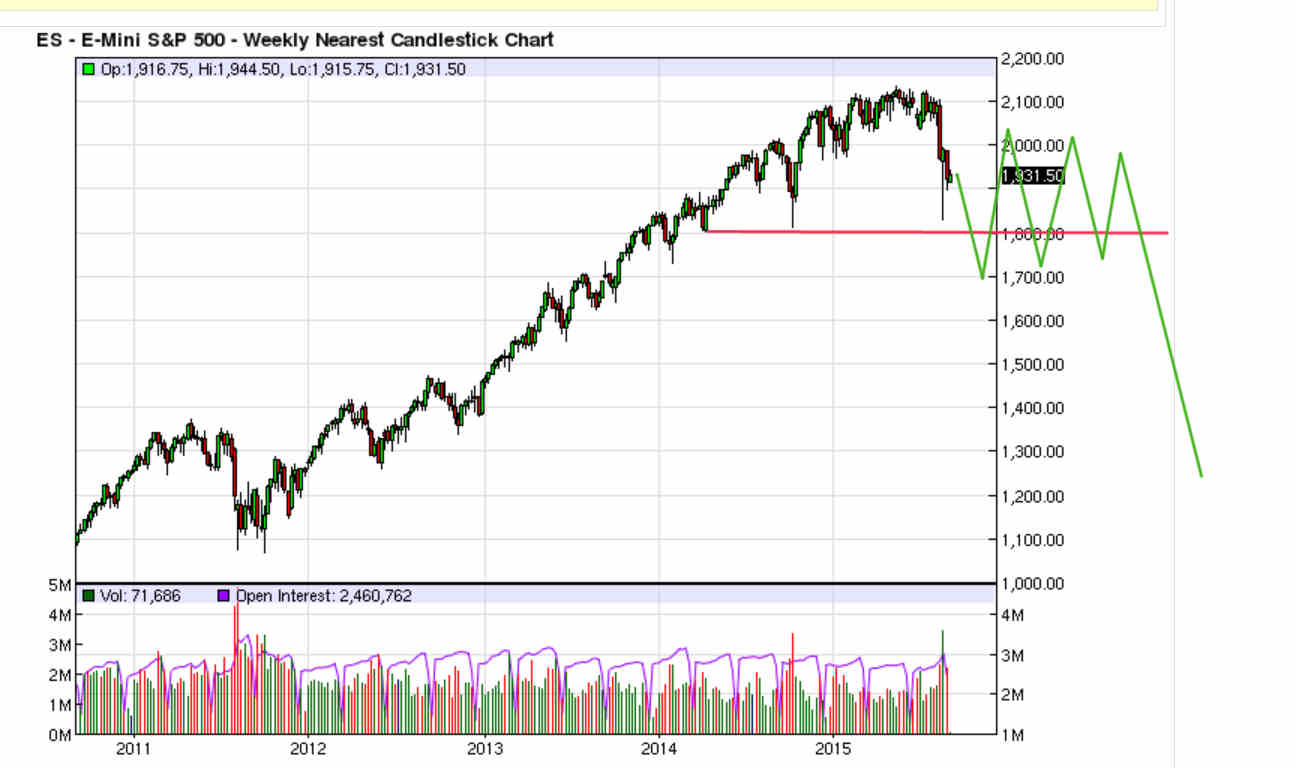
If ES drops more than 5% from its H&S neckline, but either fails to set up a price channel for that drop or puts in a normal price channel bottom at around 1700, it could put in a sharp retrace but would likely fail to make a new all-time high. In this scenario, you’d often see a kind of triangle right shoulder form.
A good example of this type of set-up would be the 2011-2012 top on gold. The dollar is putting in this type of top right now.
A >5% Drop from the H&S Neckline without a Price Channel, or with a Price Channel Bottom Near 1700, would Likely Mean a Big Triangle Right Shoulder
Set-Up for a Crash
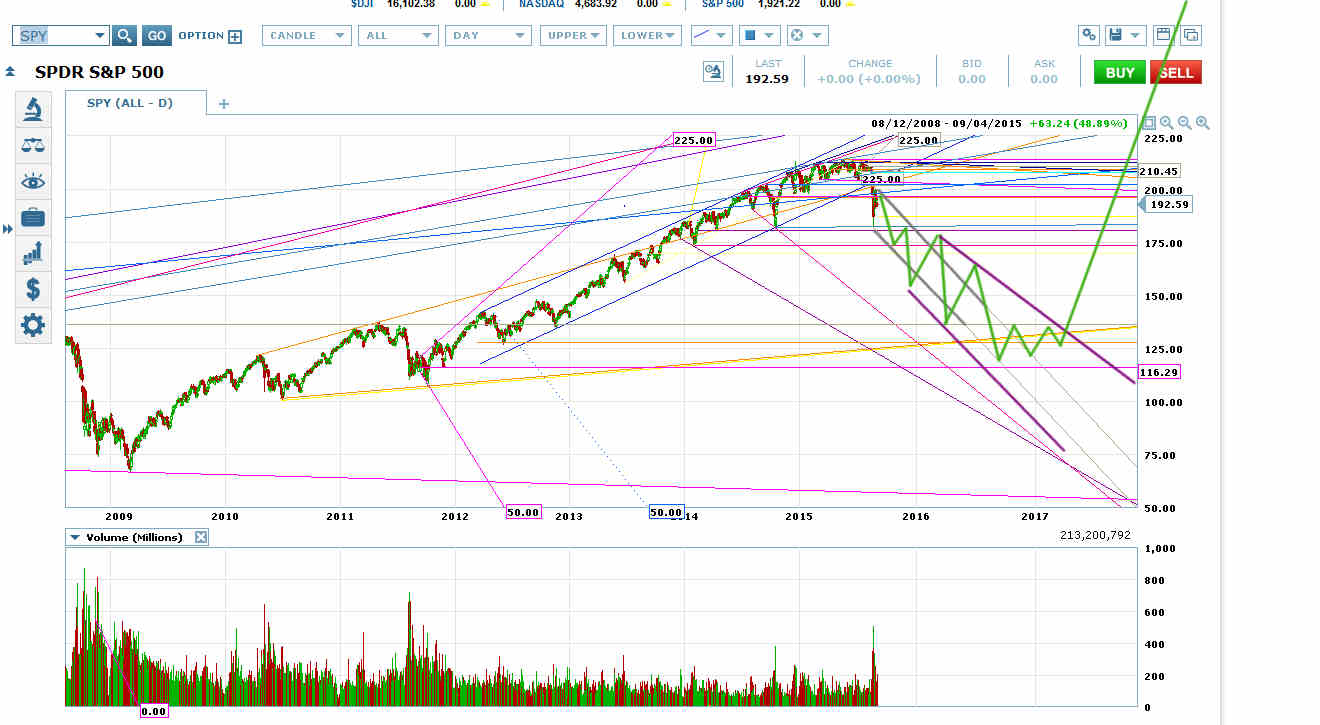
But if ES forms a price channel for this breakout, and drops more than 5% from the H&S neckline, it would have an excellent chance of either a straight-out crash or a falling megaphone crash like the one in 2000.
Potential 2015 Falling Megaphone Crash on SPY Chart
What If ES Fails to Take Out the August 24 Low?
If ES breaks out upwards from the short-term pink megaphone in the top chart, it will mean that a very bearish set-up (the Neely rising wedge) has failed. That ought to lead to a strong surge, but would not necessarily mean the NYMO lower low set-up had failed.
There’s a mandatory retrace to ES 2080 that hasn’t been filled yet. Sometimes at the start of big moves these retraces don’t happen–it’s sort of like a breakaway gap that doesn’t fill.
But if ES is going to blow a perfect set-up for taking out the August 24 low, I assume it will at least put in the retrace to 2080. From there, it could megaphone to 2113.
This scenario is unlikely. But if ES is going to put in a big move up like this, we ought to see a set-up for it emerge soon

