
Shares of SPDR Gold Shares (GLD) have been the subject of bearish forecasts by us for several months now.
Critical Support
The metal is approaching critical support that will determine whether the bull market is ending or if a reversal is near.
Just a week ago we wrote: We are looking for another test of the February 20th correction lows at $150.84 over coming days. But for the sake of those who like trying to do so, we will peg the bottom of this decline around the $145.00 level. With share prices holding just above the $150 level which acted as support back in June, 2012, we are looking for one more break lower, and then a quick selloff to the $145 level.
As of this writing, GLD was trading at $150.22, a break of the correction-support lows reached on February 20 at $150.84.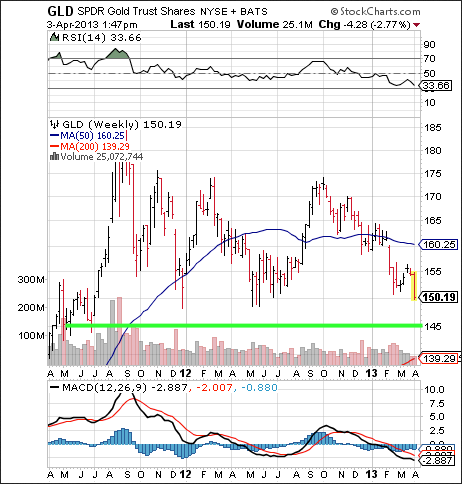
Chart Courtesy of StockCharts.com
The $145 level is now close and this is the do-or-die long term support level for GLD.
Levels To Watch
If GLD makes a decisive close below $145, look for the selloff to escalate. This long term support level goes back to May and July of 2011.
If we reverse at or above $145, and especially if we get a bullish reversal day, we could have a tradable rally ahead.
Even with a rally, the $145 remains a threat -- if broken -- in coming weeks. Only a new defined uptrend would cancel out the current downtrend in gold. That will take time, assuming $145 holds.
The Fibtimer.com (http://www.fibtimer.com) ETF Timing Strategy does not have a position in the SPDR Gold Shares.
- English (UK)
- English (India)
- English (Canada)
- English (Australia)
- English (South Africa)
- English (Philippines)
- English (Nigeria)
- Deutsch
- Español (España)
- Español (México)
- Français
- Italiano
- Nederlands
- Português (Portugal)
- Polski
- Português (Brasil)
- Русский
- Türkçe
- العربية
- Ελληνικά
- Svenska
- Suomi
- עברית
- 日本語
- 한국어
- 简体中文
- 繁體中文
- Bahasa Indonesia
- Bahasa Melayu
- ไทย
- Tiếng Việt
- हिंदी
SPDR Gold Shares Headed to $145
Latest comments
Loading next article…
Install Our App
Risk Disclosure: Trading in financial instruments and/or cryptocurrencies involves high risks including the risk of losing some, or all, of your investment amount, and may not be suitable for all investors. Prices of cryptocurrencies are extremely volatile and may be affected by external factors such as financial, regulatory or political events. Trading on margin increases the financial risks.
Before deciding to trade in financial instrument or cryptocurrencies you should be fully informed of the risks and costs associated with trading the financial markets, carefully consider your investment objectives, level of experience, and risk appetite, and seek professional advice where needed.
Fusion Media would like to remind you that the data contained in this website is not necessarily real-time nor accurate. The data and prices on the website are not necessarily provided by any market or exchange, but may be provided by market makers, and so prices may not be accurate and may differ from the actual price at any given market, meaning prices are indicative and not appropriate for trading purposes. Fusion Media and any provider of the data contained in this website will not accept liability for any loss or damage as a result of your trading, or your reliance on the information contained within this website.
It is prohibited to use, store, reproduce, display, modify, transmit or distribute the data contained in this website without the explicit prior written permission of Fusion Media and/or the data provider. All intellectual property rights are reserved by the providers and/or the exchange providing the data contained in this website.
Fusion Media may be compensated by the advertisers that appear on the website, based on your interaction with the advertisements or advertisers.
© 2007-2025 - Fusion Media Limited. All Rights Reserved.