The SPDR S&P Bank ETF ((KBE), formerly SPDR KBW Bank ETF, seeks to closely match the returns and characteristics of the S&P Banks Select Industry Index.
This is an order flow note -- OTM call buying for size. The ETF has traded over 31,000 contracts on total daily average option volume of just 1,810. Calls have traded on a 1485:1 ratio to puts.At least 30,000 of those contracts are purchases in a customer account -- opening May 26 calls. The Stats Tab and Day's biggest trades snapshots are included (below).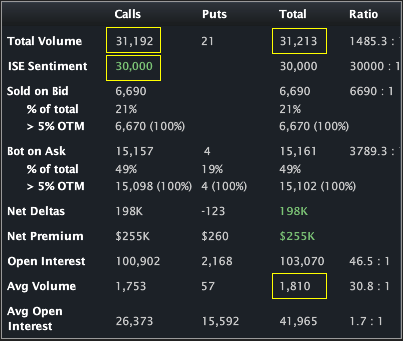

The Options Tab (below) illustrates that the calls have a massive existing OI of over 70,000. 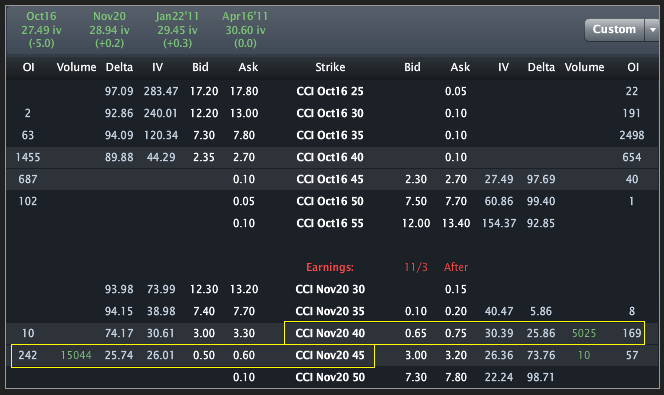
Here's where it gets interesting. Yesterday that OI was zero. 75,000 of those calls traded and of those, 70,212 netted long opening purchases. The closing options montage and days biggest trades from yesterday are included below.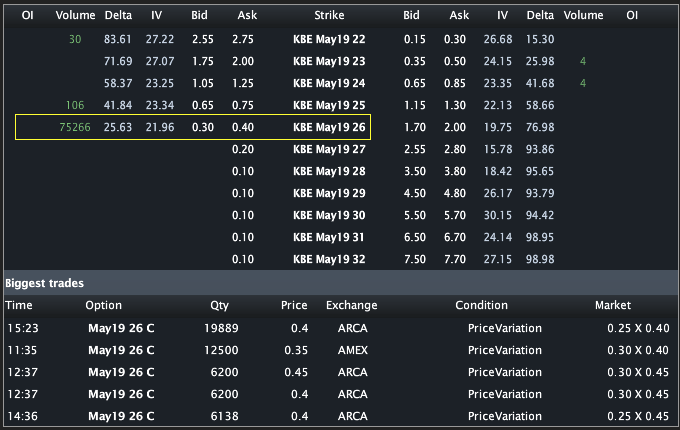
And how do I know the trades today are purchases in a custy account? Ah, the ever fleeting ISE Sentiment -- the number that represents opening calls (or puts) in customer accounts for purchases only. Check out the Stats Tab above -- the ISE Sentiment reads a green 30,000 -- that's 30,000 opening long calls from a customer on ISE.
Stock has traded heavily today, pointing to potential hedges, but the calls did not go up with stock yesterday to the floor (at least the stuff that hit NYSE ARCA).
The Skew Tab snap (below) illustrates the vols by strike by month.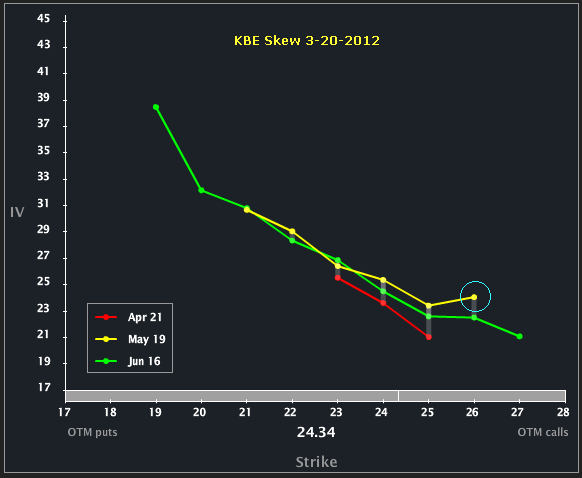
I've circled the May 26 calls. Oddly, the upside skew across the front expiries hasn't really reacted that much, though there is a slight upside bend to those May 26 calls. So the skew is essentially unaffected, right? Well, not quite...
Let's turn to the same Skew Tab, yesterday.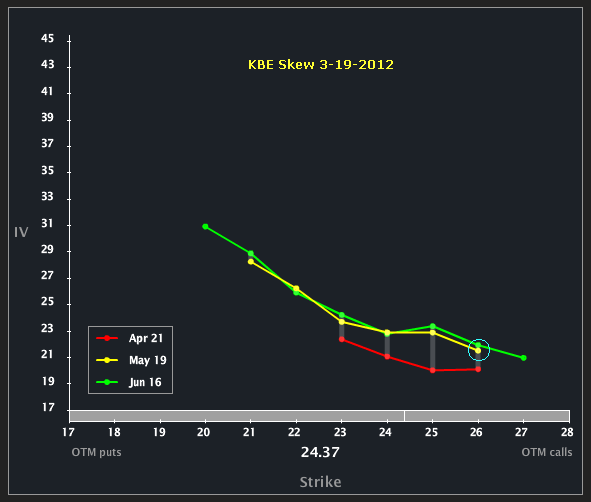
Note that when comparing yesterday to today, the ATM vol in May was below Apr, and the May OTM calls were also below Apr.Pretty cool...
Finally, the Charts Tab (six months) is below. The top portion is the stock price, the bottom is the vol (IV30™ - red vs HV20™ - blue vs HV180™ - pink).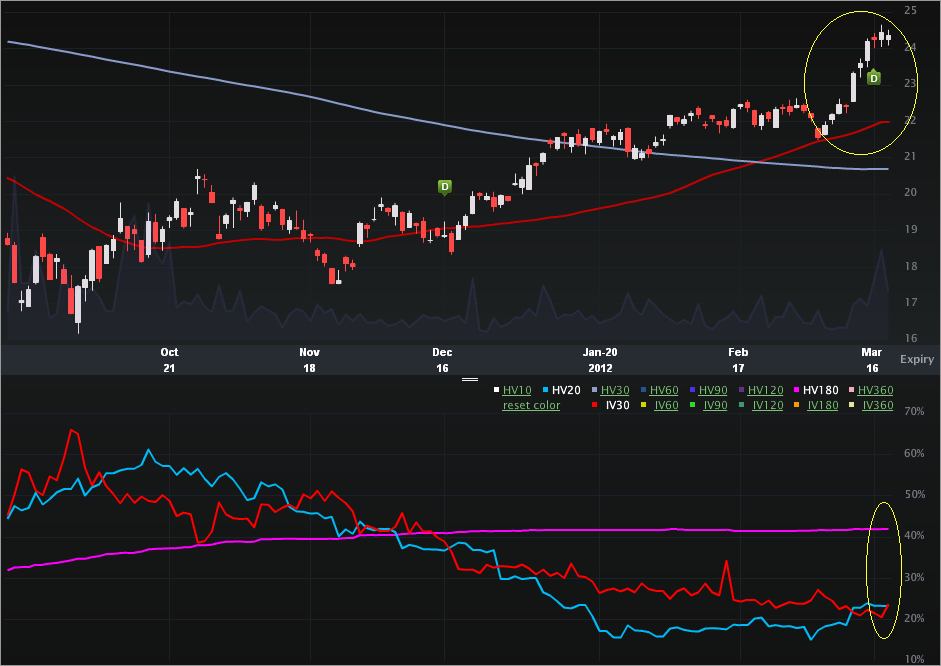
The recent price run has been impressive. On 3-6-2012 (exactly two weeks ago), the underlying closed at $21.56. That's a gain of ~13% as of this writing in a "slow moving" (23% HV20™) ETF. On the vol side, we can see a gradually declining implied. In fact, the 23.77% number as of this writing puts it in the 13th percentile (annual). The 52 wk range in IV30™ is [17.16%, 65.93%]. So we've got dipping vol, rising underlying and size upside order flow back for a second day.
This is trade analysis, not a recommendation.
- English (UK)
- English (India)
- English (Canada)
- English (Australia)
- English (South Africa)
- English (Philippines)
- English (Nigeria)
- Deutsch
- Español (España)
- Español (México)
- Français
- Italiano
- Nederlands
- Português (Portugal)
- Polski
- Português (Brasil)
- Русский
- Türkçe
- العربية
- Ελληνικά
- Svenska
- Suomi
- עברית
- 日本語
- 한국어
- 简体中文
- 繁體中文
- Bahasa Indonesia
- Bahasa Melayu
- ไทย
- Tiếng Việt
- हिंदी
SPDR Bank ETF Shows Large OTM Call Buyers for Second Consecutive Day
Published 03/21/2012, 02:51 AM
Updated 07/09/2023, 06:31 AM
SPDR Bank ETF Shows Large OTM Call Buyers for Second Consecutive Day
Latest comments
Loading next article…
Install Our App
Risk Disclosure: Trading in financial instruments and/or cryptocurrencies involves high risks including the risk of losing some, or all, of your investment amount, and may not be suitable for all investors. Prices of cryptocurrencies are extremely volatile and may be affected by external factors such as financial, regulatory or political events. Trading on margin increases the financial risks.
Before deciding to trade in financial instrument or cryptocurrencies you should be fully informed of the risks and costs associated with trading the financial markets, carefully consider your investment objectives, level of experience, and risk appetite, and seek professional advice where needed.
Fusion Media would like to remind you that the data contained in this website is not necessarily real-time nor accurate. The data and prices on the website are not necessarily provided by any market or exchange, but may be provided by market makers, and so prices may not be accurate and may differ from the actual price at any given market, meaning prices are indicative and not appropriate for trading purposes. Fusion Media and any provider of the data contained in this website will not accept liability for any loss or damage as a result of your trading, or your reliance on the information contained within this website.
It is prohibited to use, store, reproduce, display, modify, transmit or distribute the data contained in this website without the explicit prior written permission of Fusion Media and/or the data provider. All intellectual property rights are reserved by the providers and/or the exchange providing the data contained in this website.
Fusion Media may be compensated by the advertisers that appear on the website, based on your interaction with the advertisements or advertisers.
© 2007-2025 - Fusion Media Limited. All Rights Reserved.
