S&P Emini Futures Intraday Targets For January 27, 2019

Published 01/27/2020, 02:27 AM
Updated 07/09/2023, 06:31 AM
ESH25
-
VIX
-

Monday's (January 27) intraday Pivot Point targets for the S&P Emini Futures Index (ES) are (as shown on the following 30-day 60-min chart):

R3 = 3415.83

R2 = 3359.33

R1 = 3325.17

PP = 3302.83

S1 = 3268.67

S2 = 3246.33

S3 = 3189.83

Weekly VWAP = 3262.10

Monthly VWAP = 3280.73

50-hr MA = 3312.46

200-hr MA = 3311.36

*Note that the 50-hr MA is about to cross below the 200-hr MA on this 60-min timeframe...hinting of further weakness ahead if a crossover holds.

All of these levels represent intraday support and resistance levels for Monday.
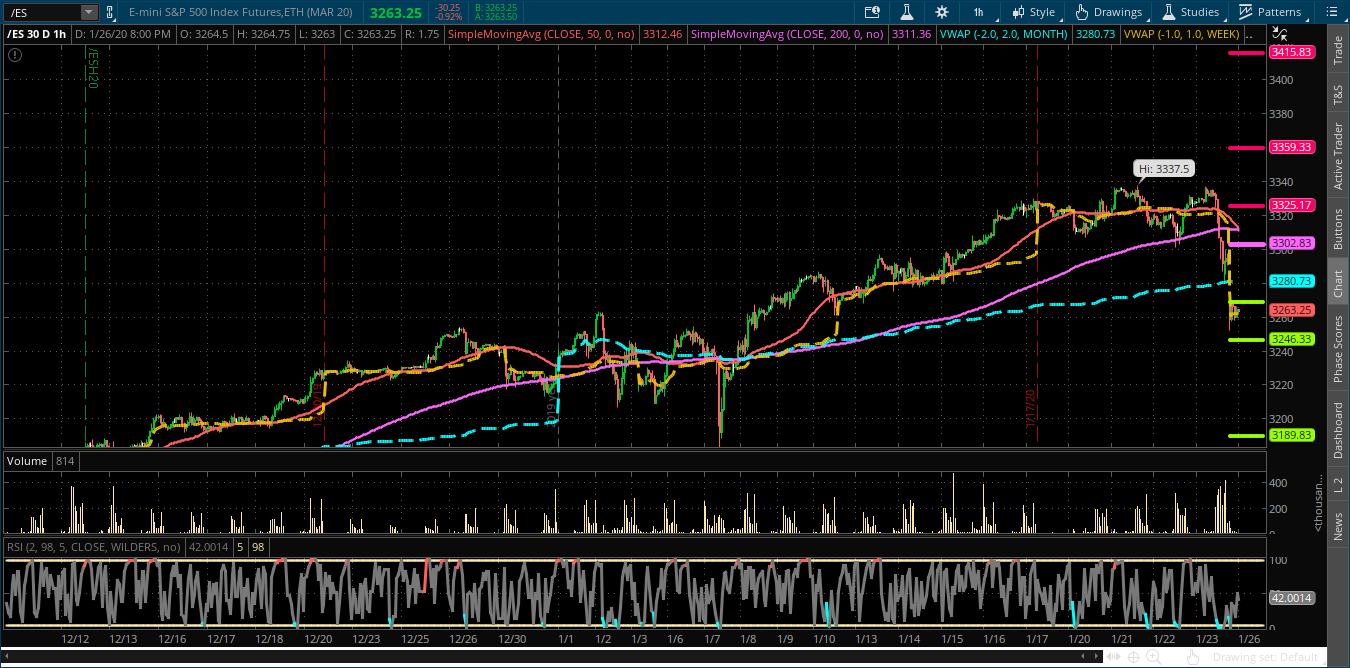
ES Chart

The following daily chart of the ES contains an Andrew's Pitchfork and a Fibonacci Retracement study.

The near term support level is around the 3223 to 3235 zone...a convergence of the bottom of the pitchfork channel and the 23.6 Fib retracement level. This zone is also the closest in price to the S2 pivot point level (3246.33). As I write this post-Sunday night around 11:30 pm ET, the ES is hovering just above S2. A break and hold below this price could send the ES to its next support level at 3189.83 (S3).

We've not yet seen an extreme spike on the Rate of Change (ROC) indicator and the Average True Range (ATR), so Sunday's night's drop may not yet be finished. Note that I've shown the input value of each of these indicators as one period and in histogram format to show (in an exaggerated view) where the extreme spikes occurred in the past, which tend to represent, either a turning point or a level at which consolidation occurs before a trend reversal takes place.
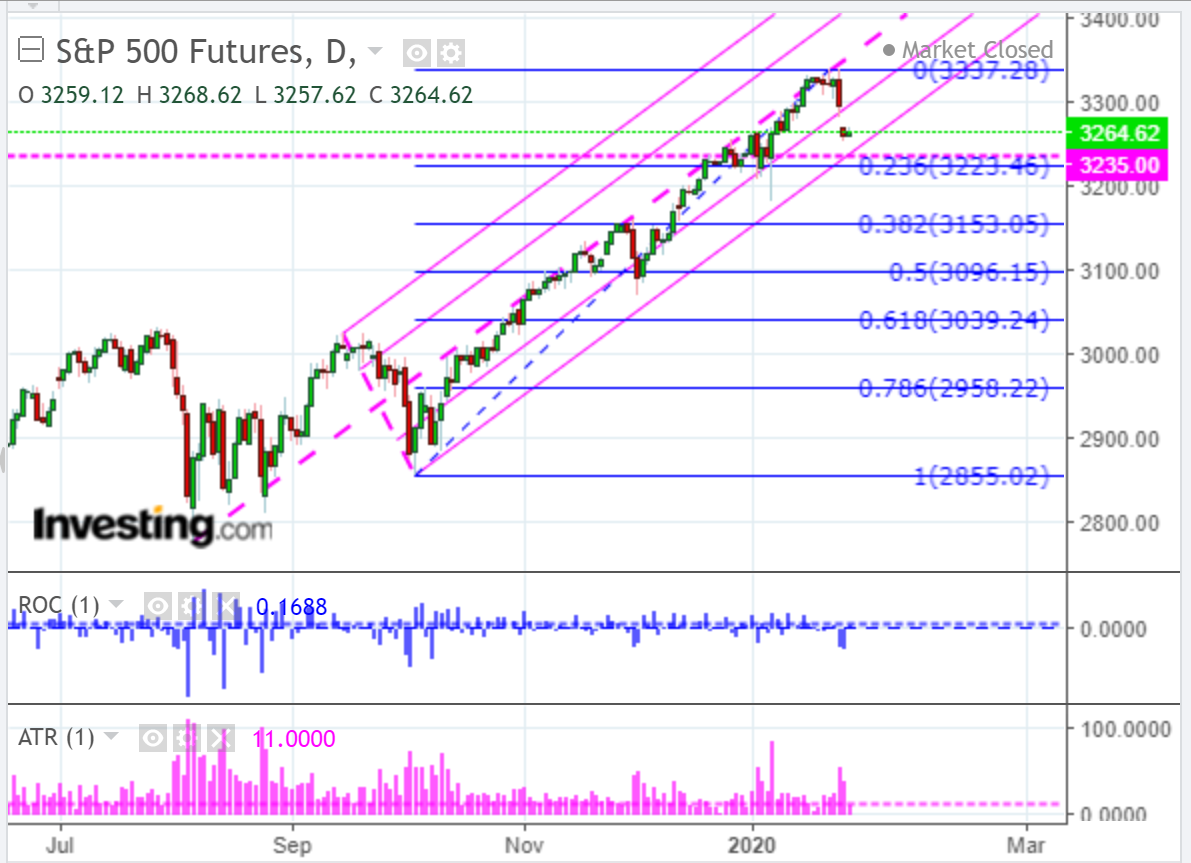
S&P 500 Futures Daily Chart

Finally, the following daily ratio chart of the SPX:VIX ratio shows that the price has dropped below the 50 MA and may be headed down to the 200 MA around the 200 price support level.

The RSI has dropped below the 50 level, and both the MACD and PMO indicators have formed a bearish crossover, all of which are hinting of lower prices on the SPX and higher volatility in the near term.

If the ES breaks and holds below S2 (3246.33), prepare for a potential drop to S3 (3189.83) and a retest of 200 (or lower) on the SPX:VIX ratio.
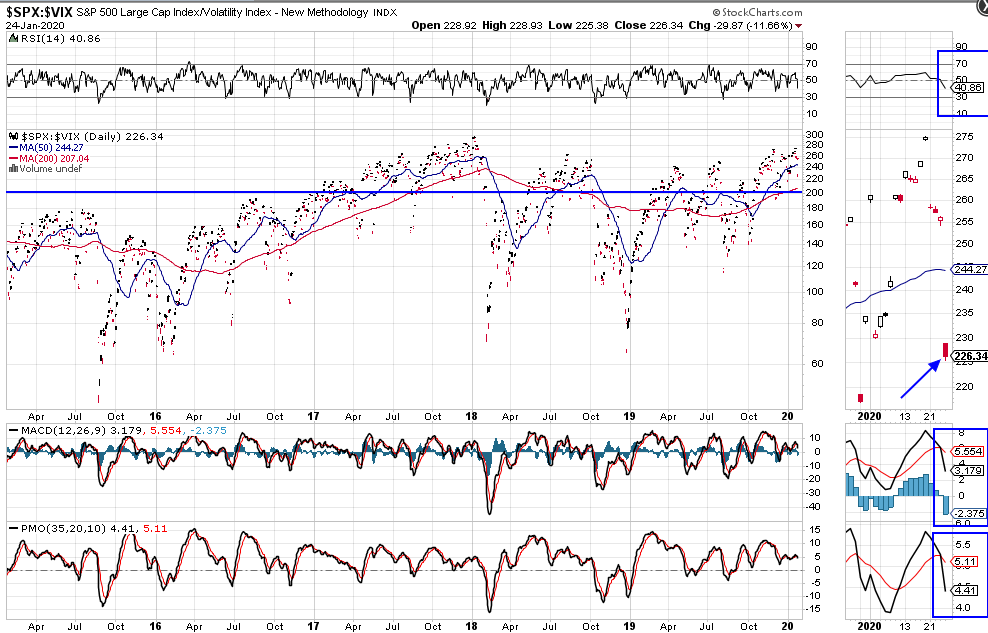
SPX/VIX Daily Chart

Latest comments

Loading next article…
Risk Disclosure: Trading in financial instruments and/or cryptocurrencies involves high risks including the risk of losing some, or all, of your investment amount, and may not be suitable for all investors. Prices of cryptocurrencies are extremely volatile and may be affected by external factors such as financial, regulatory or political events. Trading on margin increases the financial risks.
Before deciding to trade in financial instrument or cryptocurrencies you should be fully informed of the risks and costs associated with trading the financial markets, carefully consider your investment objectives, level of experience, and risk appetite, and seek professional advice where needed.
Fusion Media would like to remind you that the data contained in this website is not necessarily real-time nor accurate. The data and prices on the website are not necessarily provided by any market or exchange, but may be provided by market makers, and so prices may not be accurate and may differ from the actual price at any given market, meaning prices are indicative and not appropriate for trading purposes. Fusion Media and any provider of the data contained in this website will not accept liability for any loss or damage as a result of your trading, or your reliance on the information contained within this website.
It is prohibited to use, store, reproduce, display, modify, transmit or distribute the data contained in this website without the explicit prior written permission of Fusion Media and/or the data provider. All intellectual property rights are reserved by the providers and/or the exchange providing the data contained in this website.
Fusion Media may be compensated by the advertisers that appear on the website, based on your interaction with the advertisements or advertisers.
© 2007-2025 - Fusion Media Limited. All Rights Reserved.