The S&P 500 Futures Index is the world’s most traded stock index.
In this article, we'll make an S&P 500 forecast and also a long-term price prediction.
The assessment on the future price development of the S&P 500 index futures, uses the daily, weekly and monthly charts, as well as the long-term charts, i.e., the quarterly and yearly charts with logarithmic scale. The basis of our analysis is the Price Action and Technical Chart Analysis.
The charts used are from TradingView and the prices are from the CME.
S&P 500 Forecast Daily Chart: Climbing To Another All-Time High
S&P 500 E-Mini futures were trading at 4174 points yesterday, after breaking above the 4000 point mark and creating the next record high at 4211. The beginning of the past week was characterized by a sideways phase. On Thursday, we saw a new all-time high, after which the market fell about 35 points on Friday.
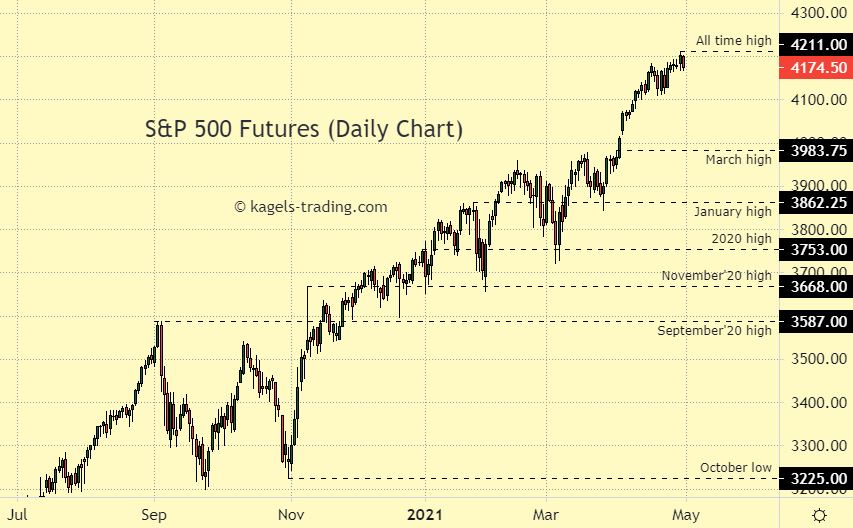
S&P 500 forecast: Index futures is quoted around 4174 points (Chart: TradingView)
Resistance Levels: 4211 (All time high)
Support: Levels 3983 | 3862 | 3753
S&P 500 forecast: Beginning from the October low at 3225, the S&P 500 futures index has been moving in an established uptrend. After reaching a new all-time high, we expect the uptrend to continue as long as the nearby support areas can be defended. On the flip side, prices below the March high would change the chart to a neutral expectation with possible sideways movement.
S&P 500 Outlook Weekly Chart: Lifted To The Next New High
S&P 500 was trading near 4170 points yesterday. The uptrend on the weekly chart was intact and the market could receive support on the March high.
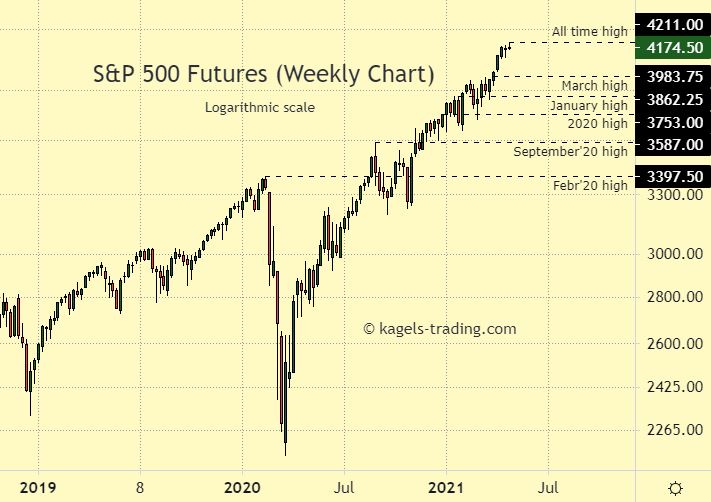
S&P 500 forecast: Market is trading close to a new all-time high (Chart: TradingView)
S&P 500 Outlook: The weekly chart looks positive. More upside potential with a continuation of the long-term uptrend has a high probability. Only a drop below the September high at 3587 could turn the positive weekly chart picture to neutral. Prices below the February ’20 high could turn the positive outlook of the weekly chart to negative.
Resistance Levels: 4211 (All time high)
Support Levels: 3983 | 3862 | 3753
S&P 500 Forecast Monthly Chart: April Closes Near New Record High
S&P 500 was trading above the March high and climbed to new record high levels. As such, we're looking at an established uptrend.
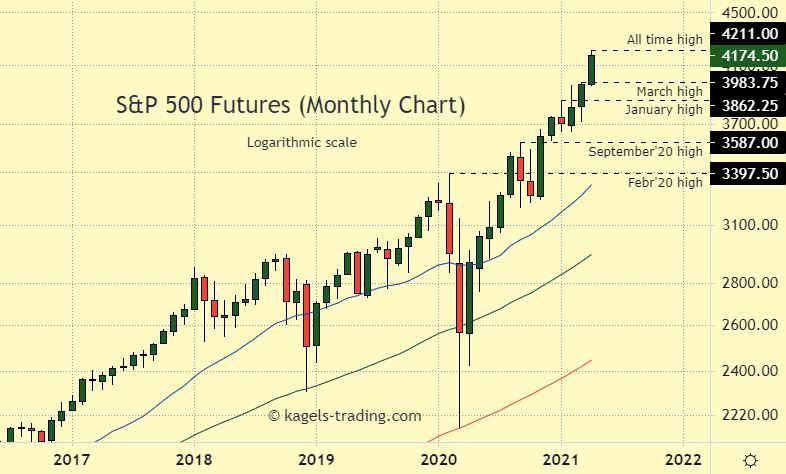
S&P 500 forecast: Market has reached the next all time high (Chart: TradingView)
S&P 500 forecast: A continuation of the uptrend in the monthly chart has the highest probability and in the longer perspective more price advance is possible. Only a drop below the February ’20 high at 3397.50 could turn the positive monthly chart picture to neutral.
Resistance Levels: 4211 (All time high)
Support Levels: 3983 | 3862 | 3587
S&P 500 Prediction: The Bigger Picture (Quarterly Chart)
In the quarterly chart showing the price action from 2012 to the current year 2021, we can see the long-term uptrend. S&P 500 has reached a new all time high in April. The market is trading above the major support of the February ’20 high which is located at 3397.50 points and also above the September high.
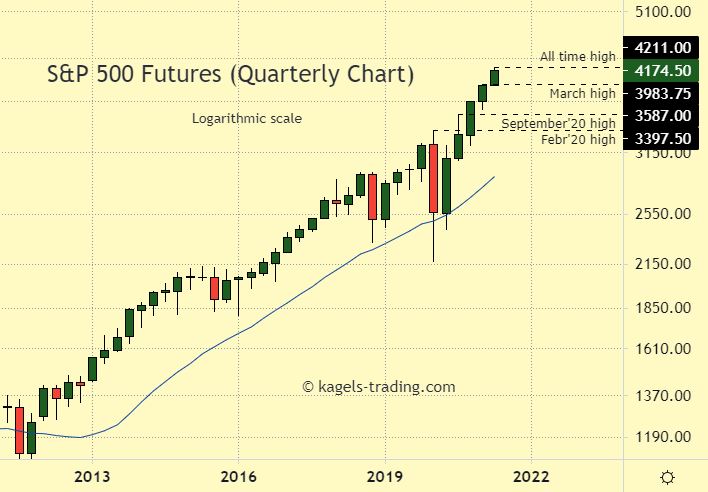
Bigger Picture—S&P 500 outlook: long-term uptrend is intact (Chart: TradingView)
Resistance Levels: 4211 (All time high)
Support Levels: 3983 | 3587 | 3397
S&P 500 outlook: We expect the S&P 500 to continue the long-term uptrend. The quarterly chart is looking positive.
Very important is the February high at 3397.50, which is key support. As long as the market is trading above this level, the outlook and bigger picture remain positive. Prices below 3397.5 would worsen the chart picture and turn the bullish outlook to neutral or negative.
S&P 500 Historical Chart And Long Term Outlook
In the S&P 500 Index yearly chart, which shows price history from 1910 until 2021, we can see the long-term uptrend.
The price bar of 2020 is a so called outside bar. In this historical chart, the 20 year simple moving average (20 SMA) is also moving upwards. In the past, the yearly 20 SMA was last tested in the financial crisis of the years 2008/2009.
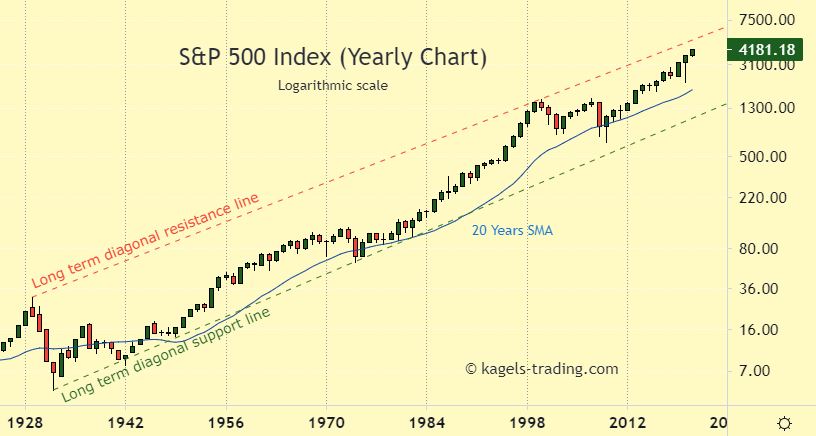
Potential Resistance is the all time high at 4218.78
Support Levels: 3247.93 | 2490.91
SMA20: 1889.23
S&P 500 forecast: We expect to see the S&P 500 resume the long-term uptrend. Only a drop below the 2020 low at 2191.86 would turn the positive long-term chart to neutral or negative. But this outlook has a very low probability of only 30%.
About The S&P 500
S&P 500—short for Standard and Poor’s 500—is a United States stock market index based on the market capitalizations of the top 500 companies that have common stock listed on the New York Stock Exchange or NASDAQ. With its headquarters in New York City and dating back to 1860, Standard and Poor’s has offices in 23 countries and maintains the S&P 500 index.
Over $1.25 trillion USD is indexed to Standard and Poor’s portfolio of indices, which includes the S&P 500. The S&P 500 index seeks to reflect the status of the whole stock market by tracking the return and volatility of the 500 most commonly held large cap company stocks on the NYSE, capturing approximately 80% of total market capitalization.
The 500 companies comprising the S&P 500 span all major industries and are selected based on their market capitalization, liquidity, ability to be traded, as well as other factors. Additionally, the importance of the S&P 500 is highlighted by its use as an economic indicator of the health of the United States economy. (Source: TradingView)
Disclaimer: Price predictions are based on the data collected from various sources. They should not be considered as investing parameters and users should do their own research before investing.
