
Bulls want a re-test of the March 29 high on the E-mini S&P 500 and a continuation higher to re-test the trend extreme. Bears want a reversal lower from a double top bear flag with the February high. Odds slightly favor a second leg sideways to up after the pullback is over.
S&P 500 E-mini futures
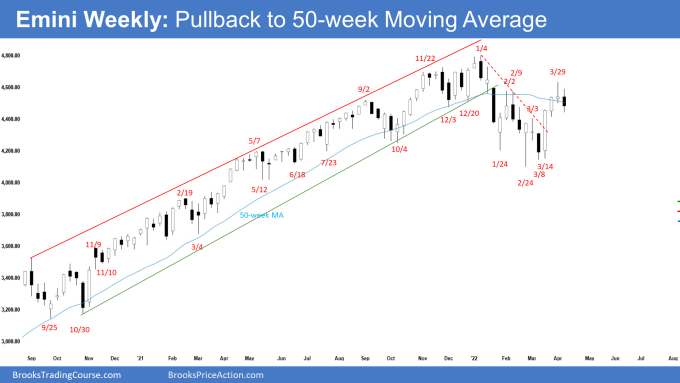
- This week’s E-mini candlestick was a bear bar with prominent tails above and below.
- Last week, we said that odds slightly favor sideways to up after a small pullback. This week was the pullback.
- Bears want the E-mini to stall around February 2 high and reverse lower from a double top bear flag. They want next week to have another bear body. That would be the consecutive bear bar and represent follow-through selling.
- We have said if the bears get strong consecutive bears bars closing near their low, odds will swing in favor of a test of the February low and possibly a breakout below. This remains true.
- The bears want a strong break below the February 24 low which is the neckline of the double top bear flag and a measured move down towards 3600 based on the high of the 8-month trading range.
- Bulls hope that the move up from March 14 is the start of the reversal to re-test the trend extreme followed by a new high.
- We have said that the bulls expect at least a small second leg sideways to up, even if there is a small pullback first in the next 1-2 weeks. This remains true.
- So, which is more likely? A pullback and a continuation higher or a double top bear flag and a reversal lower?
- The E-mini is currently trading around the middle of the 8-month trading range. Lack of clarity is the hallmark of a trading range. Odds are, the current move up is a bull leg within a trading range, and sellers will return as the E-mini moves towards the January high.
- This week’s candlestick was a bear bar but it has a prominent tail below and it followed a strong rally from March 14. It is not a very strong sell setup for next week. The bears will need at least a micro double top or a strong sell signal bar before they would be willing to sell aggressively.
- For now, odds slightly favor sideways to up after the pullback.
- However, if the bears get consecutive bears bar closing near their lows, odds will swing in favor of a test of the February low and possibly a breakout below.
The Daily S&P 500 E-mini chart
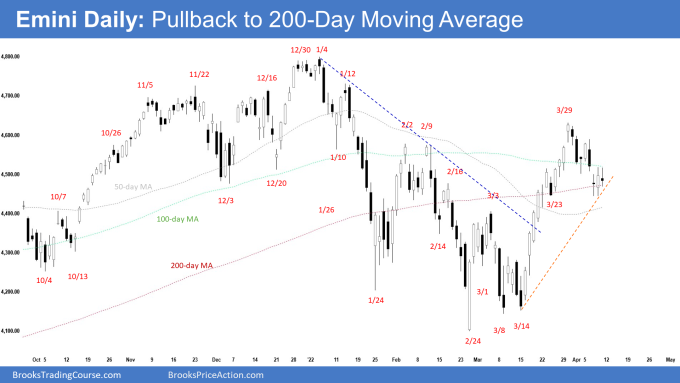
- The E-mini formed the second leg sideways to down and found support at the 200-day moving average this week.
- We have been saying that odds favor a second leg sideways to up after a slightly larger pullback that may test the March 3 high. The current move is the pullback, but it did not reach the March 3 high.
- The rally from the March 14 low was in a tight bull channel and strong enough for traders to expect at least a 2nd leg sideways to up.
- The bulls want the rally from March 14 low to re-test the trend extreme, followed by a breakout to a new all-time high.
- They will need to create consecutive bull bars closing near their highs trading far above the March 29 high to convince traders that a re-test of the trend extreme is underway.
- The bears want the E-mini to stall around the March 29 high and reverse lower from a double top bear flag or a larger double top bear flag with February 2 high.
- They then want a strong break below February 24 low and a measured move down to around 3600 based on the height of the 8-month trading range.
- The market has been in a trading range for 8 months. The trading range is more likely to continue than a strong breakout from either direction.
- The E-mini is currently trading around the middle of the 8-month trading range which is neutral.
- Odds are the current rally from March 14 is a bull leg in the trading range and we will likely see more sellers emerge as the E-mini moves towards the prior trend extreme.
- For now, traders are deciding if the pullback is done, or if it has another 3rd sideways to down leg, to test the March 3 high around the 50-day moving average.
- If the 3rd leg sideways to down forms but then stalls around the March 3 high, there would be a wedge bull flag pattern. From there, odds are we will see buyers return and the second leg sideways to up to re-test March 29 high.
- However, if the bears manage to get strong consecutive bear bars trading far below the March 3 high instead, the odds of a test of February low increases.