
Emini daily chart
- o The S&P 500 Futures formed a disappointing follow-through bar yesterda after Monday’s strong bull reversal bar.
- o The market has been in a trading range for several trading days. This increased the odds that Monday’s bull reversal bar would get a disappointing follow-through.
- o Monday’s breakout is strong enough to expect a send leg up. This will increase the chances of the bulls getting a second leg up and a test of the December 28th high and the March 2022 high.
- o The selloff down to the moving average is likely a minor reversal. This means that the odds favor sideways to up trading and trend continuation of the bull rally that began in early November last year.
- o The bulls expect a test of the December 28th high because of the magnets above; the market will probably have to go a bit higher.
- o The Bears need to create more selling pressure than they have right now if they will achieve a successful major trend reversal.
- o Overall, the market will probably continue to go sideways for the next couple of days and disappoint both the bulls and the bears.
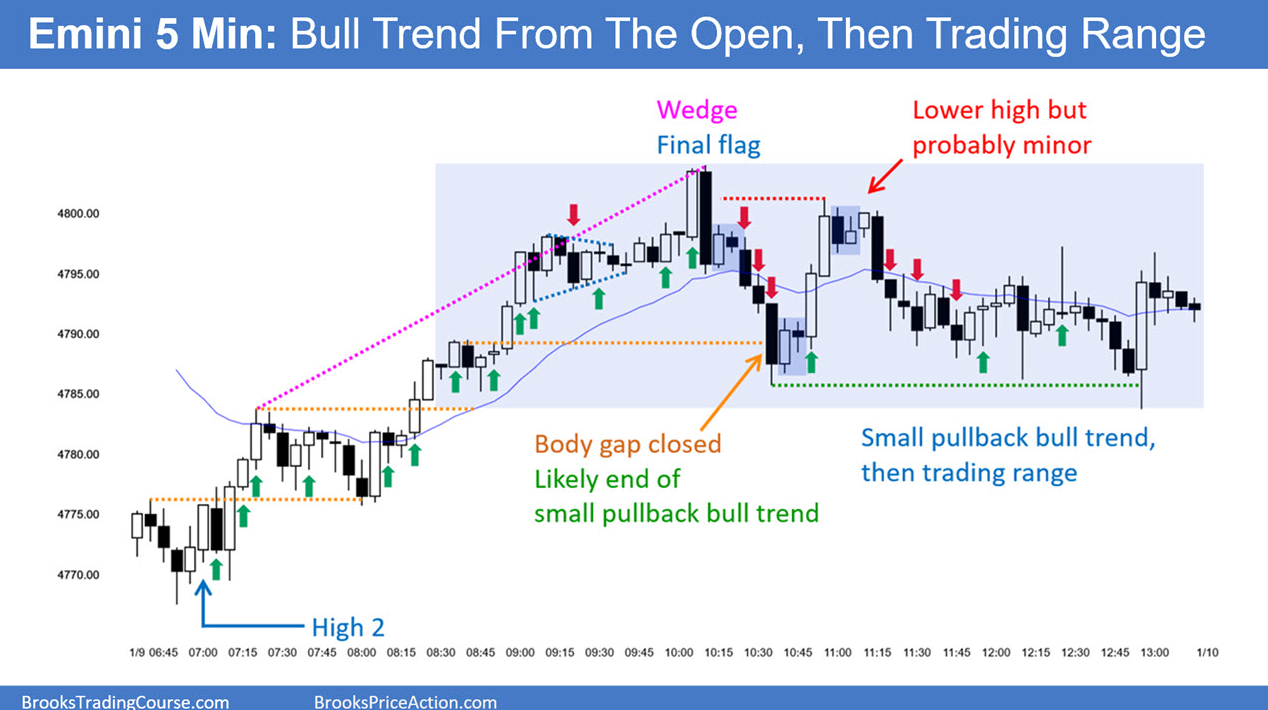
Emini 5-minute chart and what to expect today
- o Emini is up 2 points in the overnight Globex session.
- o The Emini has gone sideways for most of the overnight session and will likely open around yesterday’s close.
- o Traders should expect the open to have a lot of sideways trading. This means that most traders should consider not trading for the first 6-12 bars unless they are comfortable with stops, limit orders, and making quick decisions.
- o Most traders should focus on the opening swing that often begins before the end of the second hour. It is common for the opening swing to start after the formation of a double top/bottom, or a wedge top/bottom.
- o The most important thing to remember is to be patient and wait for a setup with a favorable trader’s equation.
Yesterday’s Emini setups
Here are reasonable stop entry setups from yesterday. I show each buy entry bar with a green arrow and each sell entry bar with a red arrow. Buyers of both the Brooks Trading Course and Encyclopedia of Chart Patterns have access to a near 4-year library of more detailed explanations of swing trade setups (see Online Course/BTC Daily Setups). Encyclopedia members get current daily charts added to Encyclopedia.
My goal with these charts is to present an Always In perspective. If a trader was trying to be Always In or nearly Always In a position all day, and he was not currently in the market, these entries would be logical times for him to enter. These therefore are swing entries.
It is important to understand that most swing setups do not lead to swing trades. As soon as traders are disappointed, many exit. Those who exit prefer to get out with a small profit (scalp), but often have to exit with a small loss.
If the risk is too big for your account, you should wait for trades with less risk or trade an alternative market like the Micro Emini.