Since September 18th, the S&P 500 has been trading below a medium-term upside support line drawn from the low of June 15th. At the same time, it is trading below a newly established downside resistance line taken from the peak of September 3rd. These technical signs suggest that the near-term outlook of the index may be negative.
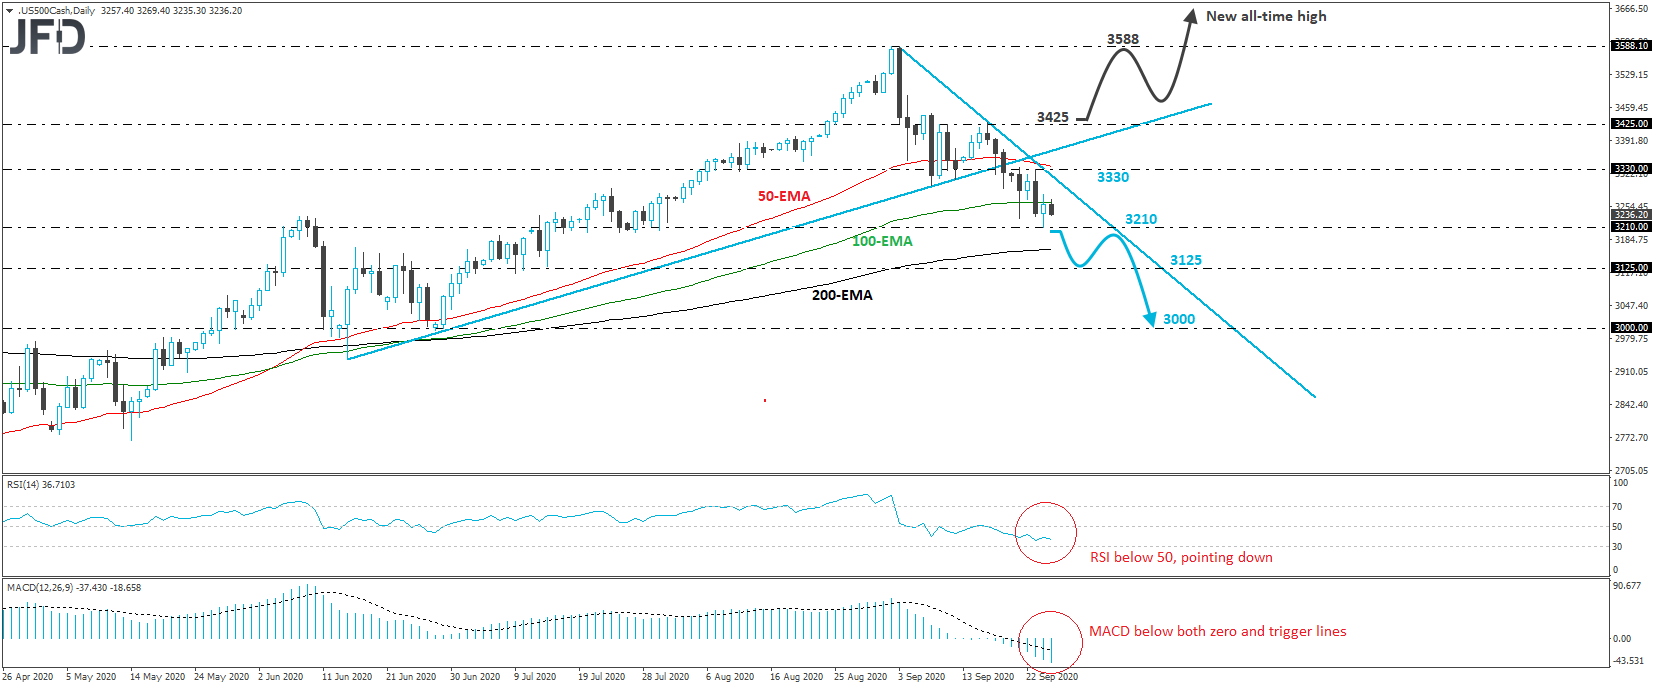
That said, in order to get confident on further declines, we would like to see a break below yesterday’s low of 3210. Such a move would confirm a forthcoming lower low and may pave the way towards the low of July 14th, near the 3125 territory. If investors are not willing to jump in near that territory, a break lower may carry more bearish implications, perhaps setting the stage for the psychological zone of 3000, last time tested on June 29th.
Shifting attention to our daily oscillators, we see that the RSI lies below 50 and points down, while the MACD runs below both its zero and trigger lines, pointing south as well. Both indicators detect downside momentum and support the notion that further declines may be on the cards.
Now, in order to abandon the bearish case and start examining whether the prevailing uptrend has resumed, we would like to see a strong recovery above 3425, defined as a resistance by the high of September 16th. This would take the index back above both the aforementioned diagonal lines and may encourage investors to push for another test near the record peak of 3588.10. If market participants are not willing to stop there, then they will enter uncharted territory, with the next possible resistance area perhaps being near 3700, which is very close to the 261.8% Fibonacci extension level of the June 9th–15th retreat.