
Microsoft Corp
Microsoft Corporation (NASDAQ:MSFT) is a technology company. The Company develops, licenses, and supports a range of software products, services and devices. The Company's segments include Productivity and Business Processes, Intelligent Cloud and More Personal Computing. The Company's products include operating systems; cross-device productivity applications; server applications; business solution applications; desktop and server management tools; software development tools; video games, and training and certification of computer system integrators and developers. (source: Reuters)
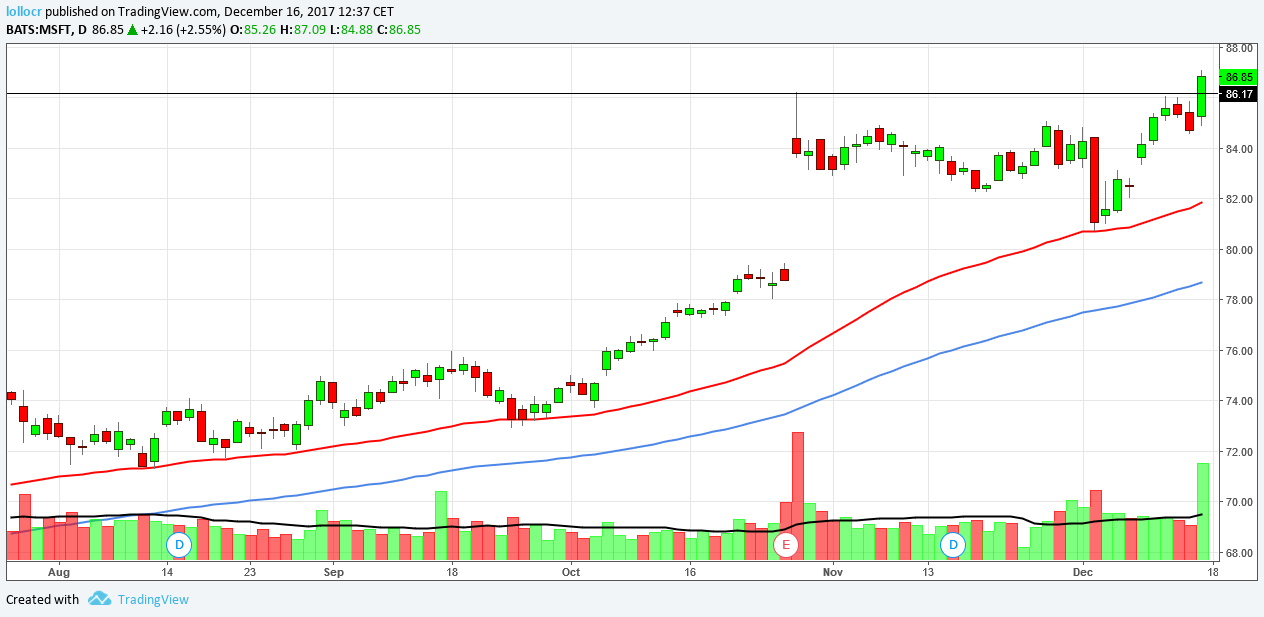
TECHNICAL ANALYSIS:

FUNDAMENTAL ANALYSIS:

- The score relative to the fundamental analysis is based on my own algorithm that calculates more than 140 indicators divided into different areas; In this analysis, about 50 of the 140+ indicators will be shown, selected according to the importance and the sector in which the company operates. The analysis refers to the annual (and quarterly) Income statement and Balance sheet of the last 3/5 years.
- The indication "Including: vs. Industry " refers to the comparison between some indicators of the company and the average ones of the industry (for example, the" industry "of Facebook (NASDAQ:FB) is" internet services "and not" Technology "). (the result is already included in the total score of the single area).
- The indication "n" in the “Annual Growth” graph refers to the year of the last annual Income statement and Balance sheet available.
- The indication "n" in the chart "Quarterly - YoY - Growth" refers to the last quarterly Income statement available.
- The "Quarterly - YoY - Growth" chart shows the trend in revenue, operating income and net income in the last quarter, compared to the same quarter 12 months earlier.
- The numbers inside the charts are in millions.
- The term "TTM" in the chart refers to the Trailing Twelve Months (sum of the last 4 quarters available)
- The two moving averages on the price chart are the Exponential moving average 50 and the Exponential moving average 100, while the moving average on the volume chart is the Simple moving average 20.
DISCLAIMER: The information in this blog post represents my own analysis/opinions and does not contain a recommendation for any particular security or investment.