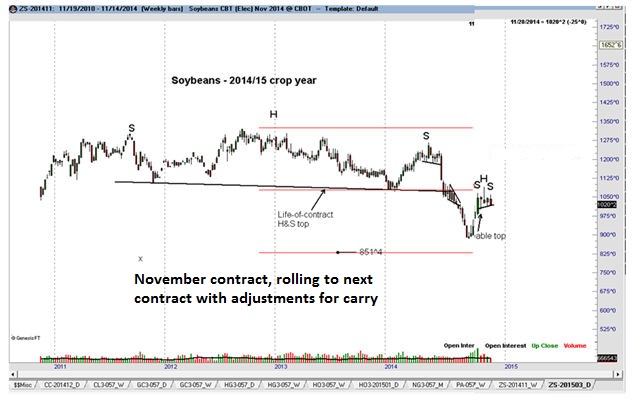
Dominant technical pattern is a 3.5-year head-and-shoulders top on the weekly 2014/15 crop-year chart.
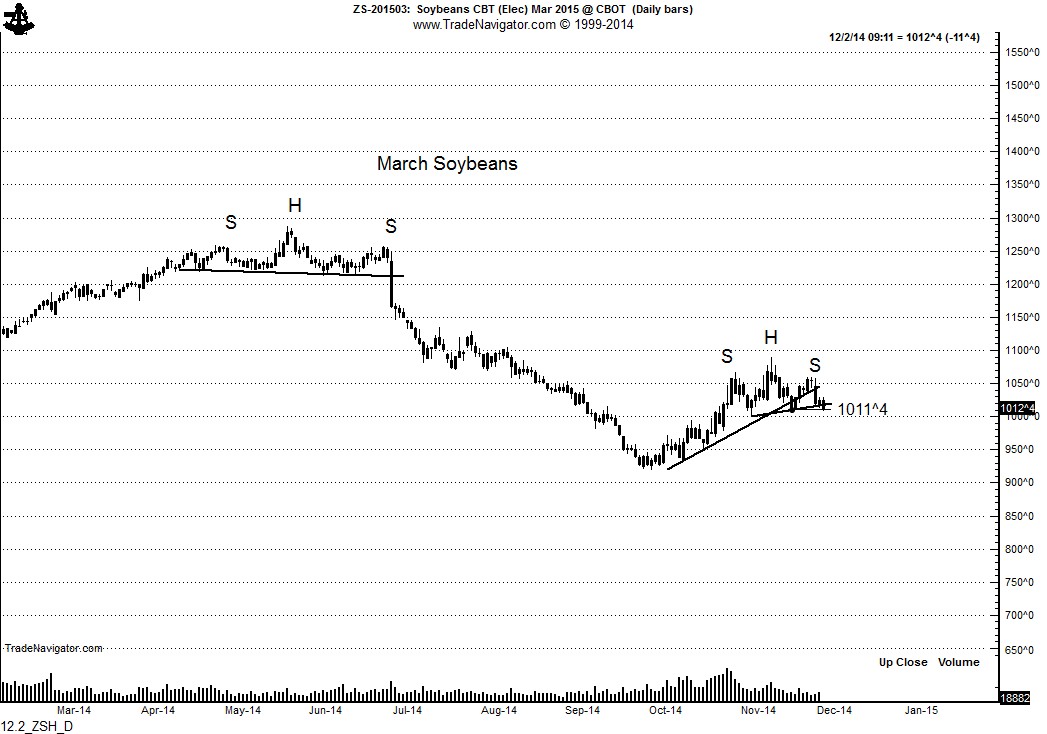
H&S top retest on the daily chart could spell the start of the decline toward $8.
The life-of-contract weekly chart for November soybeans (now expired) displays a massive 3.5-year head-and-shoulders top pattern. The Factor is maintaining a proxy chart of old crop 2014/15 beans by rolling the November chart to the March contract, and so forth. We will continue to maintain this chart as we progress through the year.
The rally from the March contract from early October through mid November was likely just a retest of the weekly chart H&S pattern. Now the March contract is forming an independent 5-week H&S top pattern.
A decisive close by the March contract below 1008 would complete this daily chart top and re-establish the bear trend in beans. The Factor has maintained for months that sometime during the 2014/15 crop year the bean/corn ratio would return to 2.4, perhaps 2.3 on an overshoot. At $3.50 corn, this equates to beans in the $8 to $8.50 zone, a price area indicated by the 2014/15 old crop weekly chart.


