March 9th, 2016
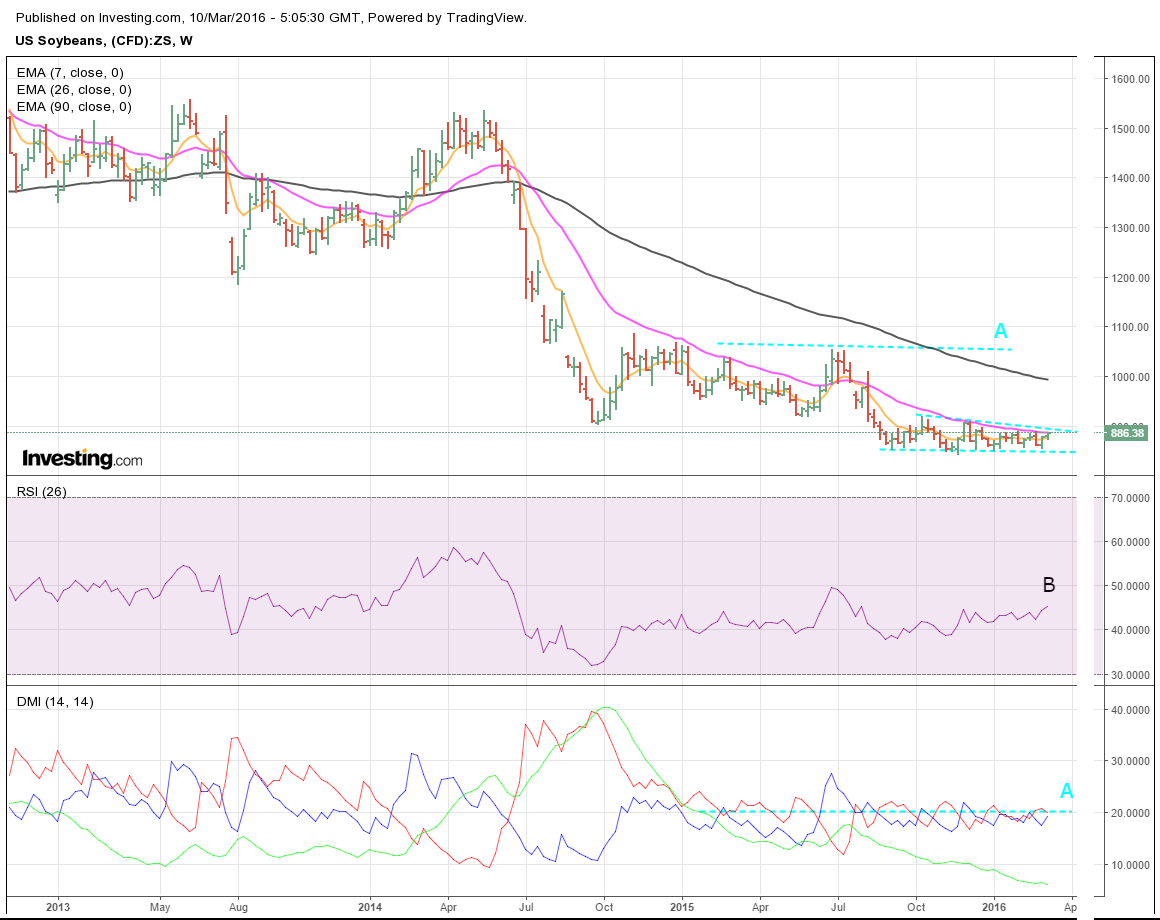
Since the October 2014 timeframe, the soybean market, along with some of its friends in the Grains complex has been flat to down with spurts of volatility. In the past 29-30 weeks, soybeans have been really flat drifting sideways in a narrow range
The Weekly Chart 
- The ADX is trending down well below 20 and has been below 20 since early 2015 (A)
- The 26 period RSI has been stuck in a 40-45 range with the exception of one blip (B)
- Price has maintained two different channels with the second being extremely tight (A)
- The 26 period EMA is holding both price and the 7 period EMA
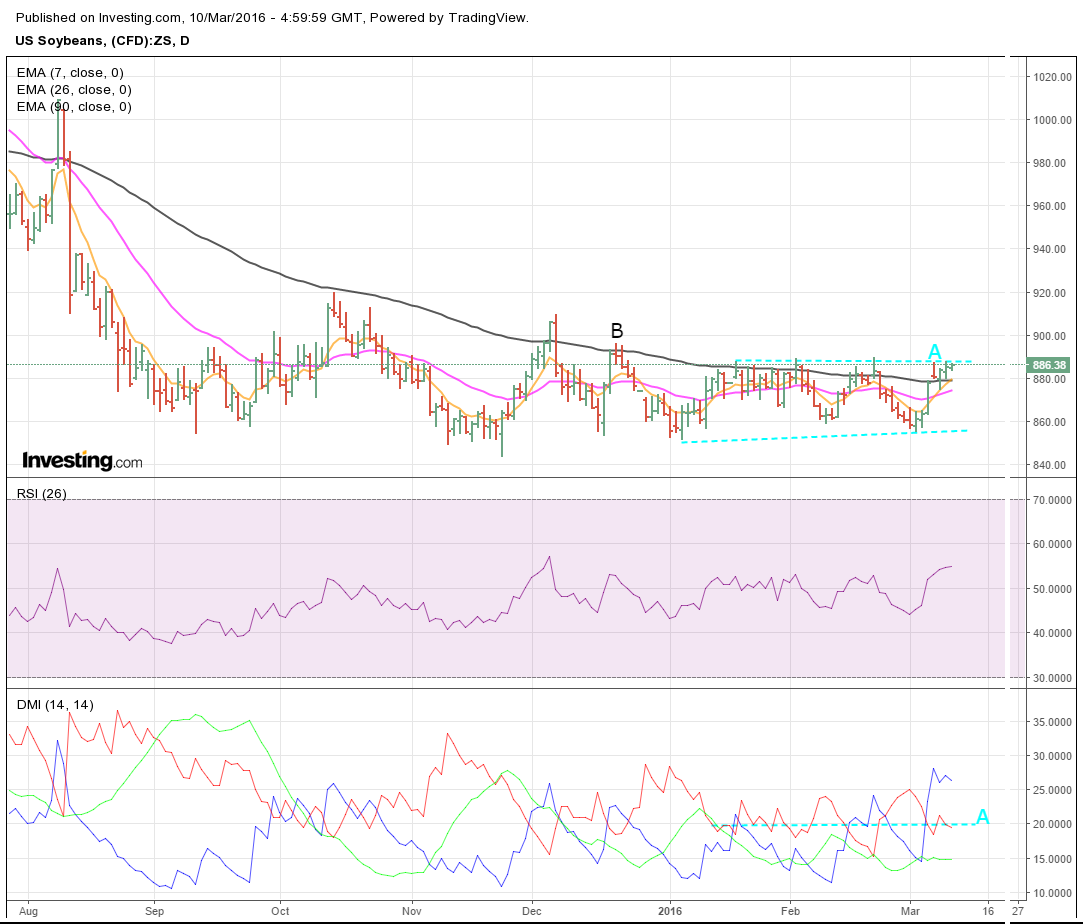
The Daily Chart 
Since January 2016, basically same story as weekly
- Price has broken above the 90 period EMA
- 90 period EMA still holding the 7 and 26 period EMA (B)
- ADX is below 20 with price in tight channel since January 2016 (A)
- 26 period RSI fluctuating around 50
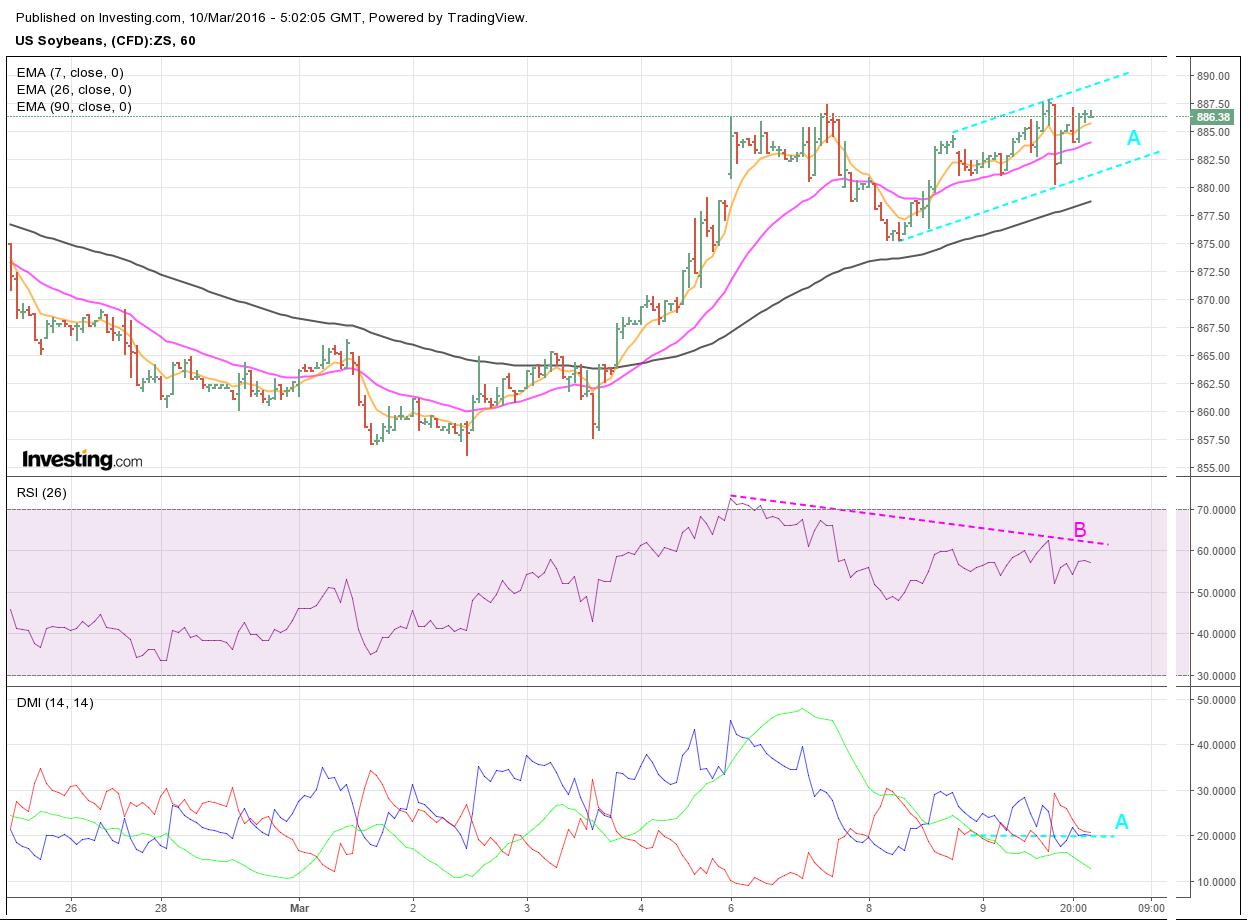
The Hourly Chart 
- 26 period RSI diverging with price from the high placed above 70
- With ADX below 20 since 9th, price looks like it is consolidating into a channel
What to Watch
- Current resistance holds and prices drift back down to support on the daily chart. If support holds then we most like start the process over again
- On the daily chart, the resistance line (A) is broken by price and the 7 and 26 period EMA cross above 90. If there’s follow through, this would be reflected in the weekly chart and an up move of larger magnitude may be in play
A possible strategy might be to place a buy above the daily resistance line with a close stop. Otherwise, stand aside and let time evolve the market action on both the daily and weekly charts.
