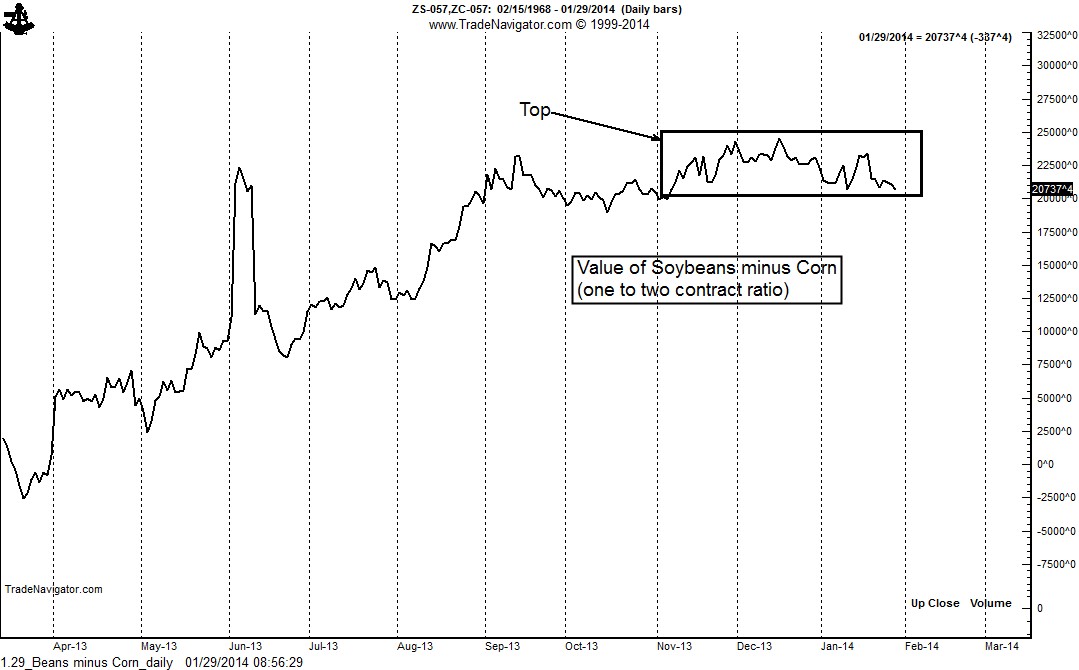
The quarterly chart below shows the value of one contract of Soybeans minus the value of two contracts of Corn. The Soybean/Corn spread is often traded on a one-to-two ratio.
The daily chart shows that the spread could be turning. Spread charts sometimes display classical patterns. The daily chart displays a possible rounding top.
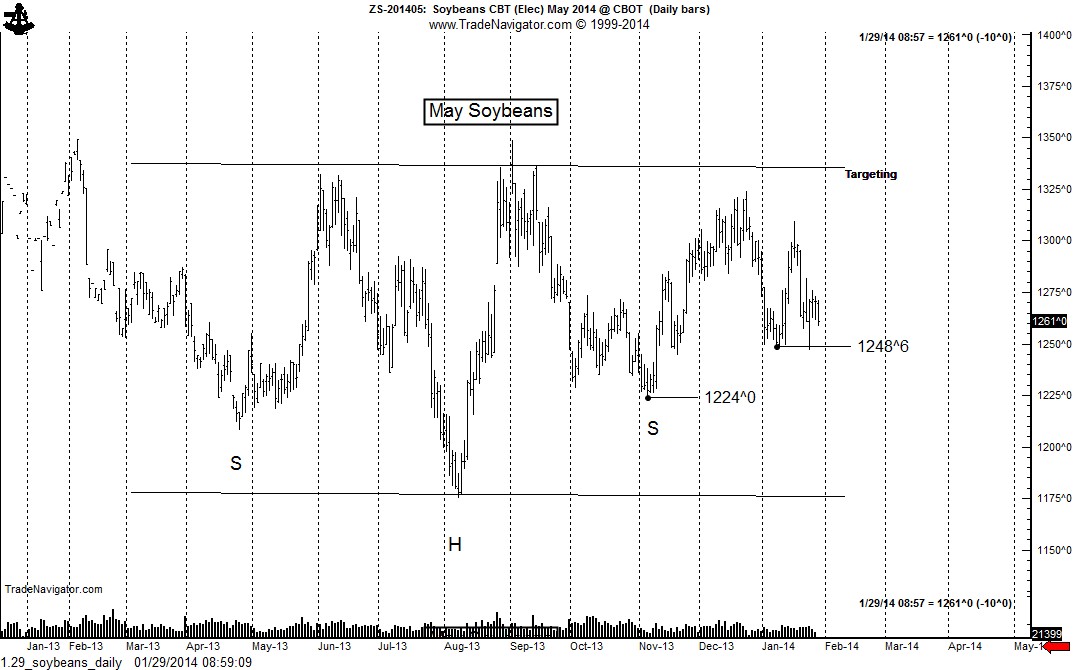
The daily Soybean chart is in a tenuous position technically. The May contract displays a possible 11-month H&S failure pattern, pending a close below the November low. A close below the January low could launch the completion of the H&S failure.
I am very close to pulling the trigger on this trade.
At a minimum, the May contract should test its contract lows below 1180.
Disclosure: The information in this blog post represents my own opinions and does not contain a recommendation for any particular security or investment. I or my affiliates may hold positions or other interests in securities mentioned in the Blog, please see my Disclaimer page for my full disclaimer.


