The South African economy has been experiencing low demand for its exports and going through a political turmoil that has weighed on its economy’s growth.
However, per data released by Stats SA, South African economy has dodged recession. A recession is termed as two consecutive quarters of negative GDP growth. Although GDP declined 0.3% in the fourth quarter of 2016 and 0.7% in the first quarter of 2017, it grew 2.5% quarter over quarter on an annualized basis in the second quarter of 2017. The economy grew 1.1% year over year (read: Recession Hits South Africa: Avoid this ETF).
Factors Driving Growth
The primary sectors, including agriculture‚ forestry and fishing have been growing tremendously. These sectors expanded 34% in the second quarter of 2017 and contributed 0.7% to overall GDP growth, per Statistician general Pali Lehohla.
The secondary sector grew 1.9% in the quarter, while the tertiary sector saw growth of 1.2%.
Downsides
The central bank has reduced its growth forecasts for this year to 0.5% and to 1.2% for 2018. Democratic Alliance MP David Maynier said that the growth is not enough to meet the needs of the unemployed and increase the income for people living below poverty line. South Africa's unemployment rate came in at 27.7% in the second quarter of 2017.
Moreover, the country has been going through immense political turmoil. President Jacob Zuma was under scrutiny for maintaining illegal ties with the Gupta family and the firing of finance minister Pravin Gordhan. Zuma survived the eighth no-confidence motion by opposition parties trying to unseat him. The motion was defeated 198 to 177 and he held on to power. Zuma and his entire cabinet would have had to resign had the motion been passed.
The motion required 201 of the 384 votes to pass, falling short by just 24 votes. The opposition cited the result as a show of optimism and strength in their fight against the apparent corrupt practices of Zuma and as a means to invigorate confidence in them to fight him in the courts.
Moreover, owing to this political uncertainty, the economy lost its investment grade rating in April by Fitch and S&P. Both S&P and Fitch currently rate the economy at BB+, their highest junk rating (read: Jacob Zuma Survives No Confidence Vote: ETFs to be Impacted).
Let us now discuss the most popular South Africa ETF in detail.
iShares MSCI South Africa ETF (AX:EZA)
This fund offers exposure to the emerging market nation of South Africa by investing in companies based out of the nation.
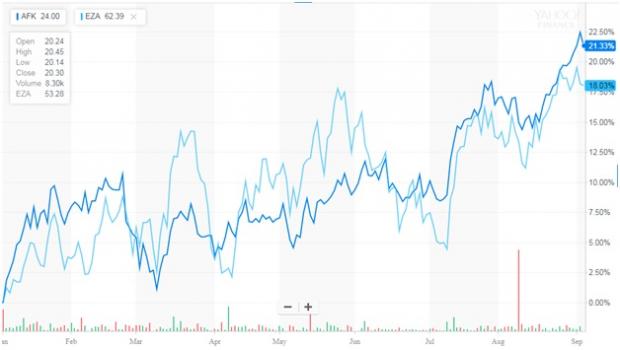
EZA has AUM of $418.37 million and charges a fee of 64 basis points a year. Consumer Discretionary, Financials and Consumer Staples are the top three sectors with 31.73%, 25.76% and 8.77% allocation, respectively (as of September 1, 2017). Naspers Limited, MTN Group Ltd and Standard Bank Group are the top three holdings of the fund, with 22.02%, 5.04% and 4.99% exposure, respectively (as of September 1, 2017). EZA has returned 8.72% in the last one year and 18.03% year to date (as of September 5, 2017). It currently has a Zacks ETF Rank #4 (Sell) with a High risk outlook.
We will now compare the performance of EZA with a broader Africa-based ETF, AFK (see all Africa-Middle East Equity ETFs here).
VanEck Vectors Africa Index ETF (OL:AFK)
This fund has more than 50% allocation to Africa, covering economies such as South Africa, Egypt, Nigeria, Morocco, Kenya and Mauritius. It also invests in offshore listings of companies incorporated outside Africa but generate at least 50% of their revenues from the continent.
It has AUM of $75.9 million and charges 79 basis points in fees per year. The fund has 30.06% exposure to South Africa. Financials, Materials and Consumer Discretionary are the top three sectors with 31.4%, 23.3% and 12.7% exposure, respectively (as of July 31, 2017). Naspers Limited, Commercial International Bank Egypt Sae and Safaricom Ltd are the top three holdings of the fund, with 7.92%, 7.47% and 4.02% exposure, respectively (as of September 5, 2017). The fund has returned 13.31% in the last one year and 21.33% year to date (as of September 5, 2017). As such, AFK currently has a Zacks Rank #3 (Hold) with a Medium risk outlook.
Below is a chart comparing the year-to-date performance of the two funds.

Source: Yahoo (NASDAQ:AABA) Finance
Want key ETF info delivered straight to your inbox?
Zacks’ free Fund Newsletter will brief you on top news and analysis, as well as top-performing ETFs, each week. Get it free >>
ISHARS-S AFRICA (EZA): ETF Research Reports
VANECK-AFRICA (AFK): ETF Research Reports
Original post
Zacks Investment Research
