I am late putting up a post tonight, because I attended an absolutely amazing lecture by Jaron Lanier on the Stanford campus. I’ve known about Jaron’s work since I first got into computers 35 years ago, but I had never heard him speak. He’s a straight-up genius. It was just an amazing talk that touched on politics, the economy, and data privacy.
Anyway. Let’s look at a handful of charts.
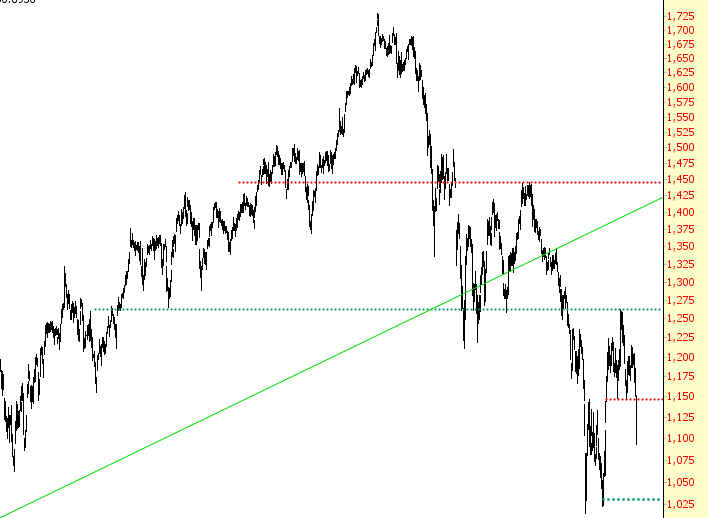
First is ARCA Oil, the oil and gas sector, which has been my dearest friend all year. The miniature head and shoulders pattern has performed great, and the lowest green horizontal is my target.

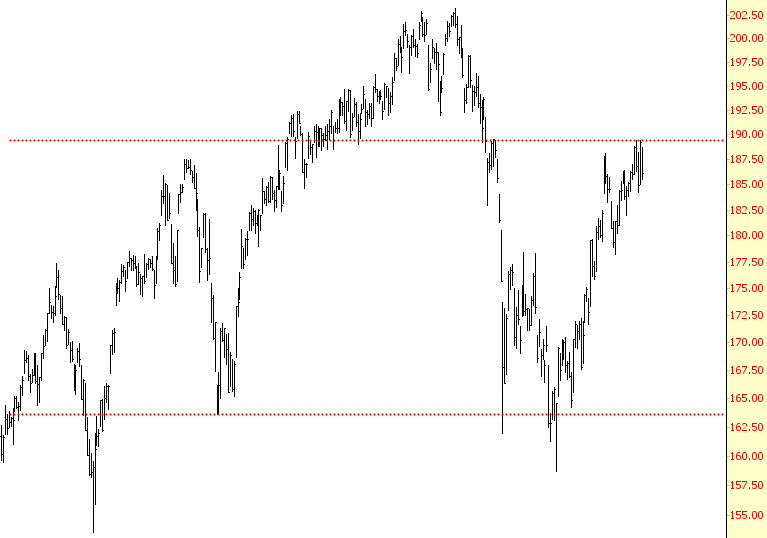
In sharp contrast to this, the ARCA Securities Broker index (often a harbinger of general market direction) has been propped up far more successfully by the central bankers, but the red line represents an important exhaustion point. I think the completely juiced-up rally from September 30th to last Friday is vulnerable, as we saw today. Mario Draghi managed to B.S. the market into a massive rally on Friday, but we’ll see just how long his B.S. fumes will persist in keeping this pig aloft.

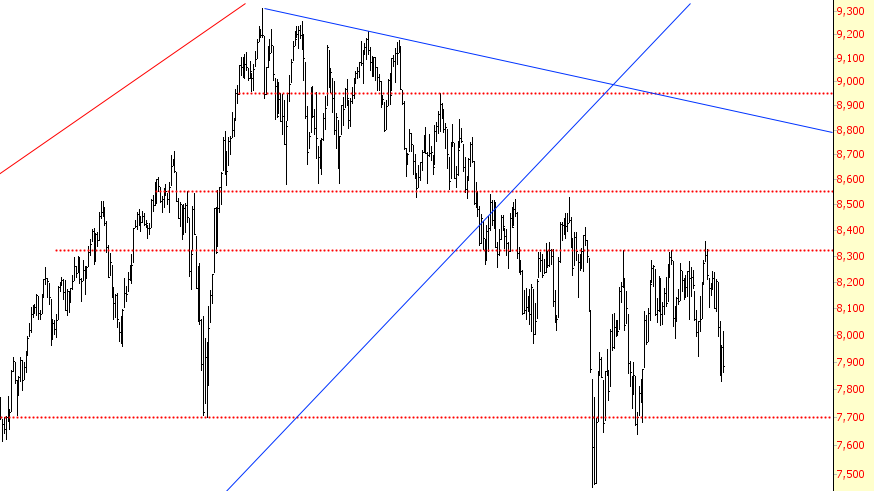
The Dow Transports have been a far more representative of the house of cards the global economy is, and the red line at about 7,700 will, I believe, be demolished in 2016. I’m trying not to get into the presidential election too much (right now, at least), but I can assure you it’s going to be the most amazing competition in decades (particularly if the terrorists have a major attack within the next year).

That’s it for now. I’ll see you good people Tuesday morning.
