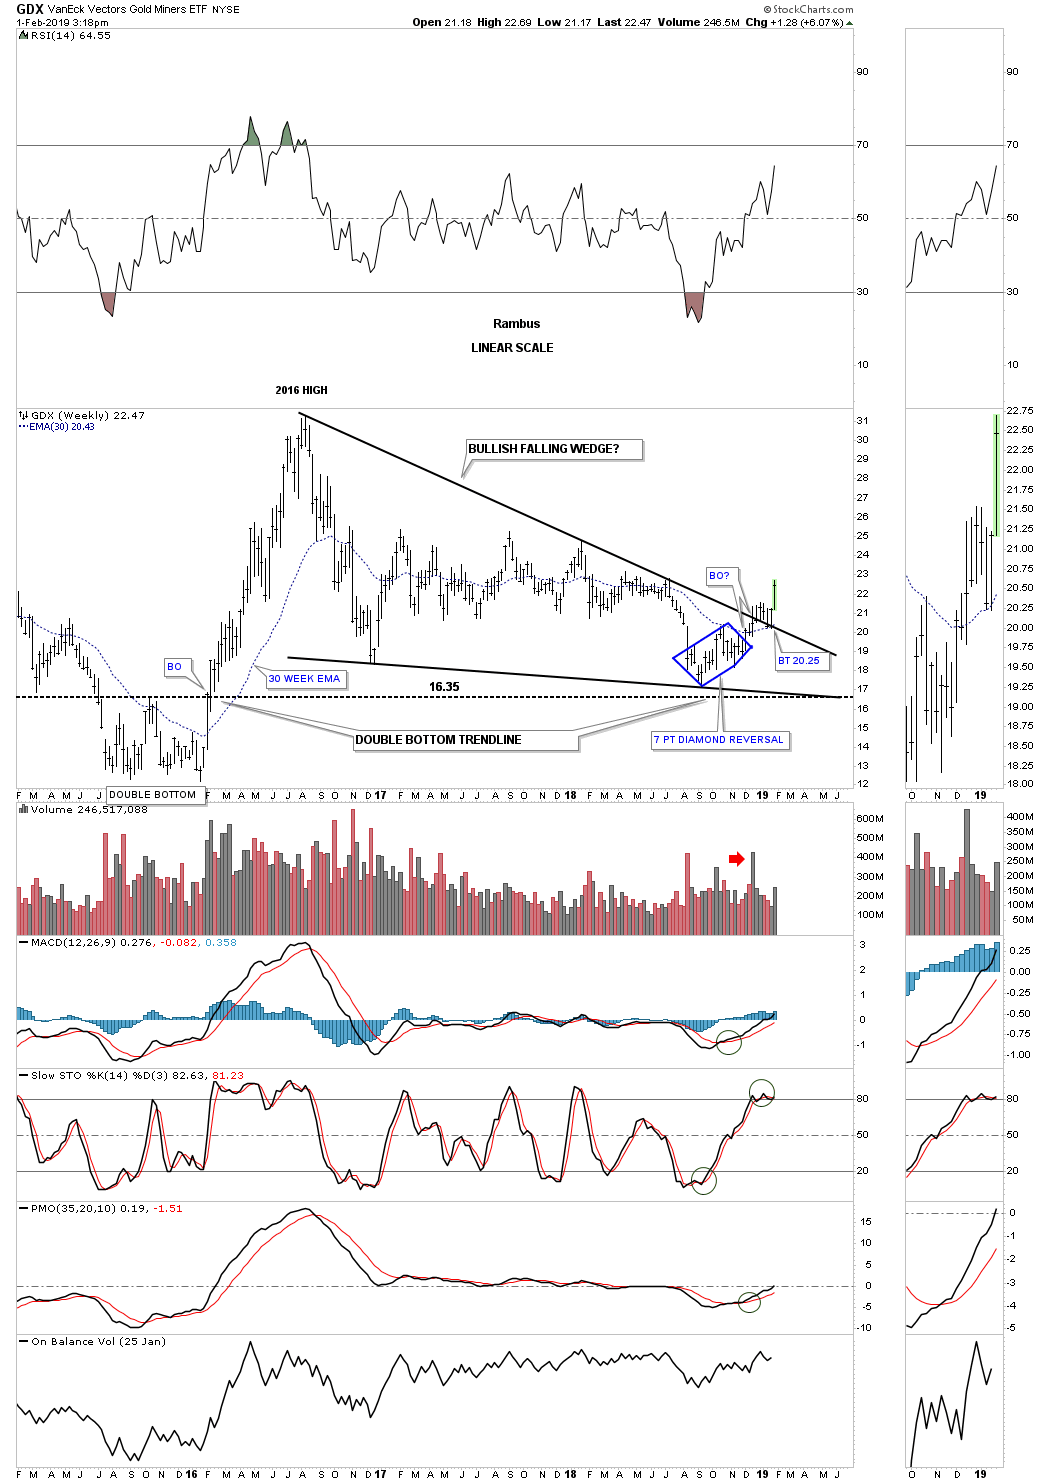
Below is a weekly chart for the VanEck Vectors Gold Miners ETF (NYSE:GDX) which we’ve been following for a long time, as we watched the two-and-a half year falling wedge complete about 8 weeks ago, when we finally got the breakout. The backtest to the top rail took about seven weeks to complete with this past week's price action possibly beginning the impulse move higher.
To be honest I still can’t rule out another backtest to the top rail and the 30 week ema, but at this point it appears the breaking out and backtesting process looks to be complete.
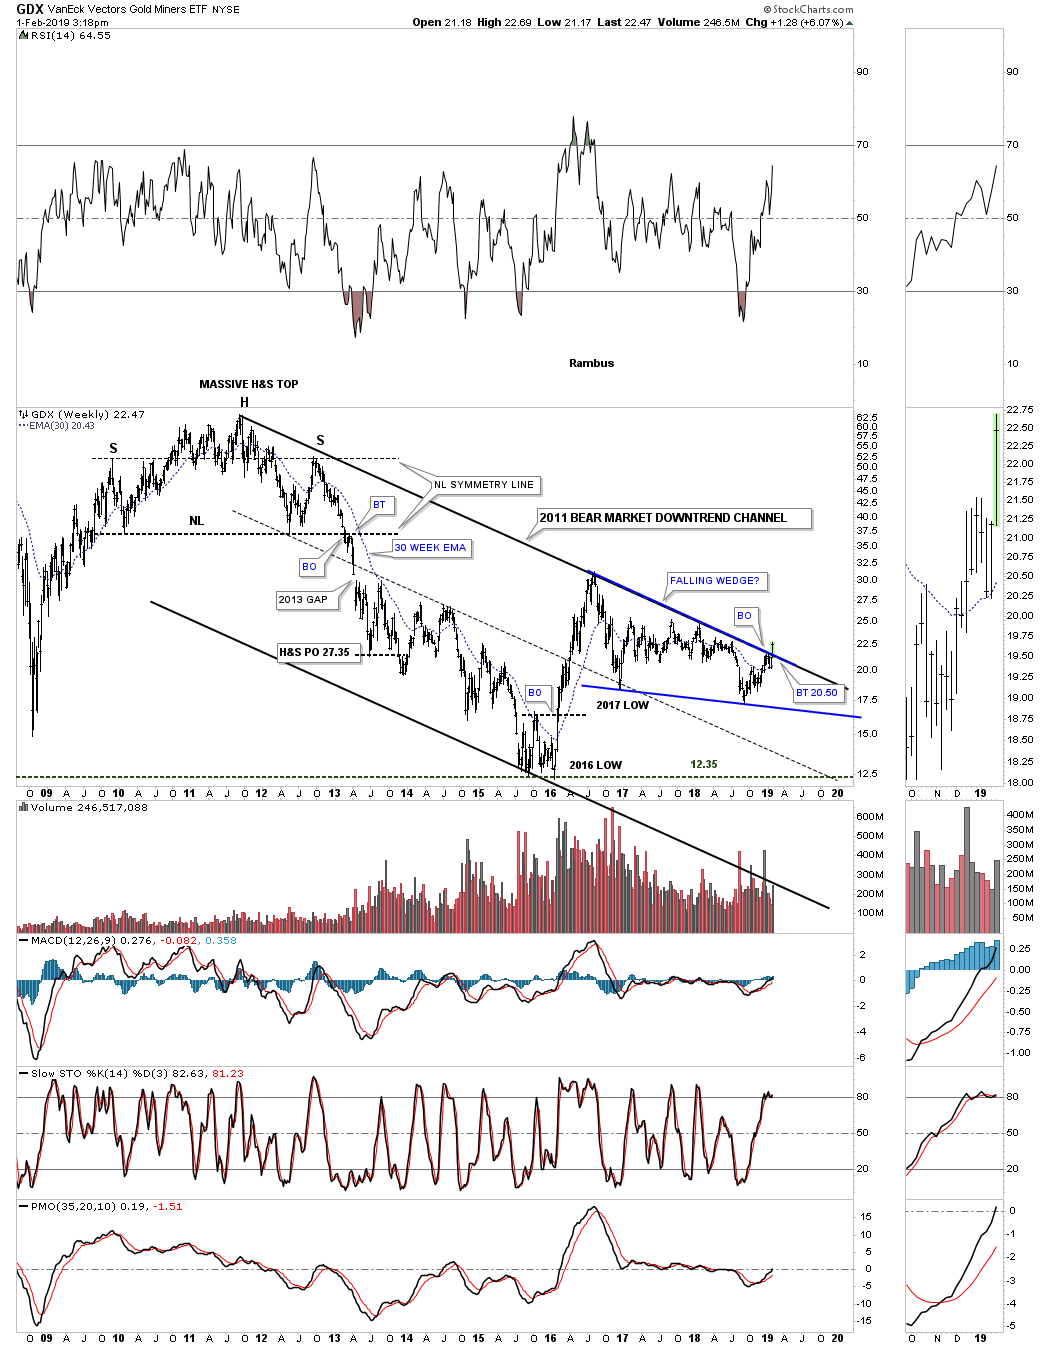
The only reason I can’t rule out a possible second backtest is because of the top rail of the 2011 bear market downtrend channel that was broken this past week and could be backtested.
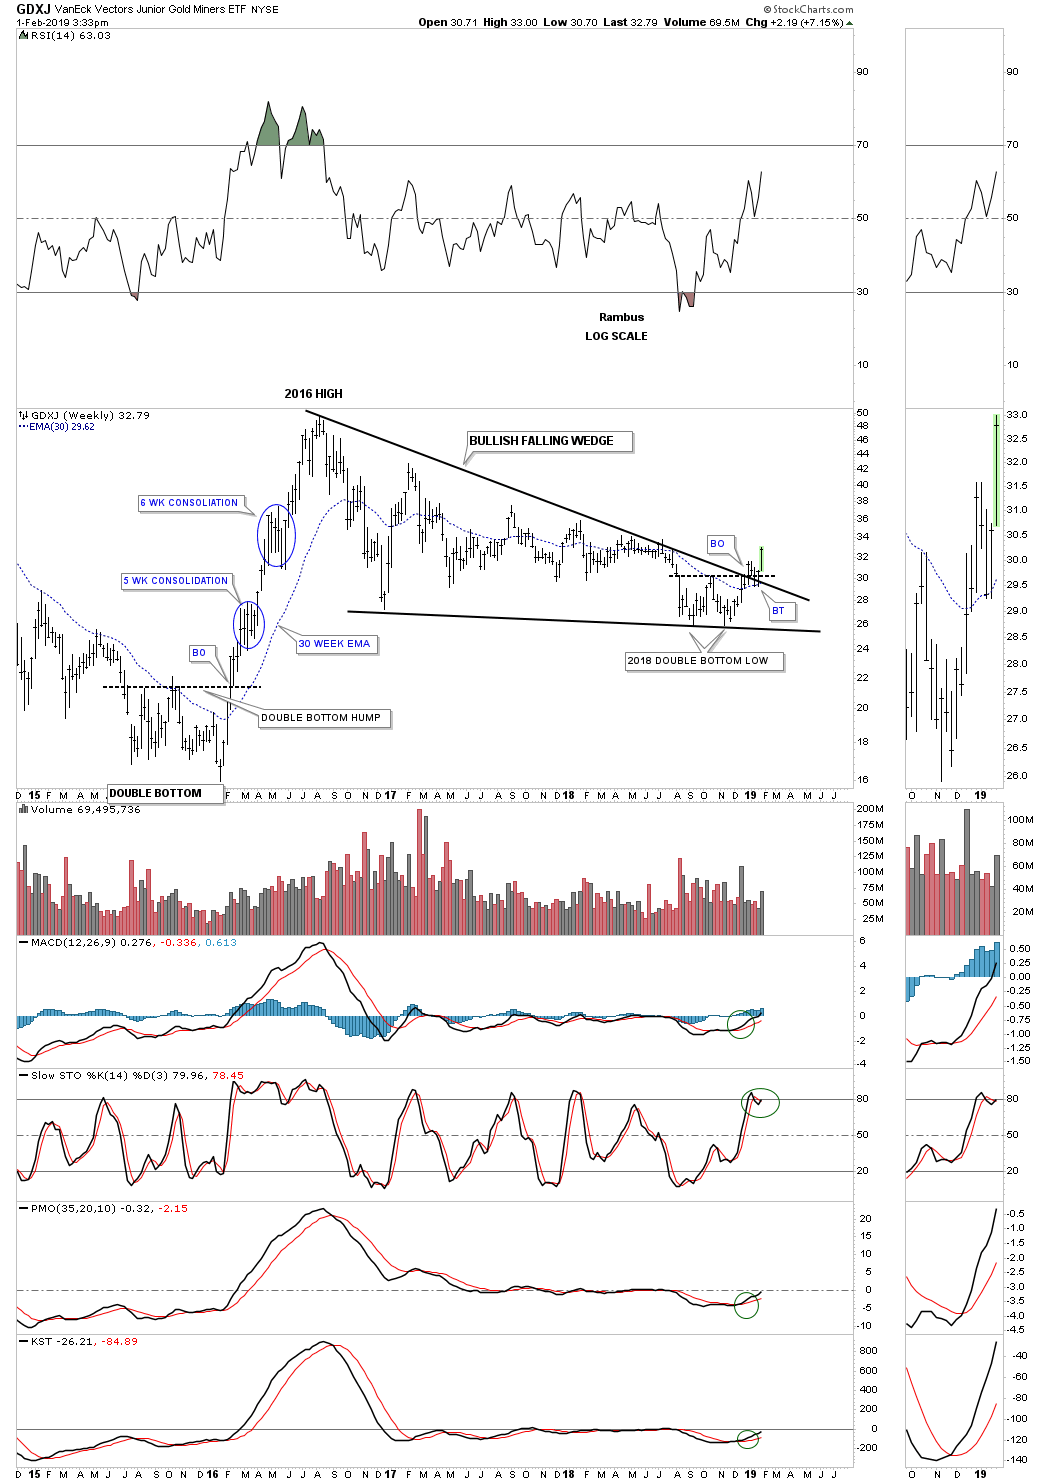
The VanEck Vectors Junior Gold Miners (NYSE:GDXJ) weekly breakout and backtest.
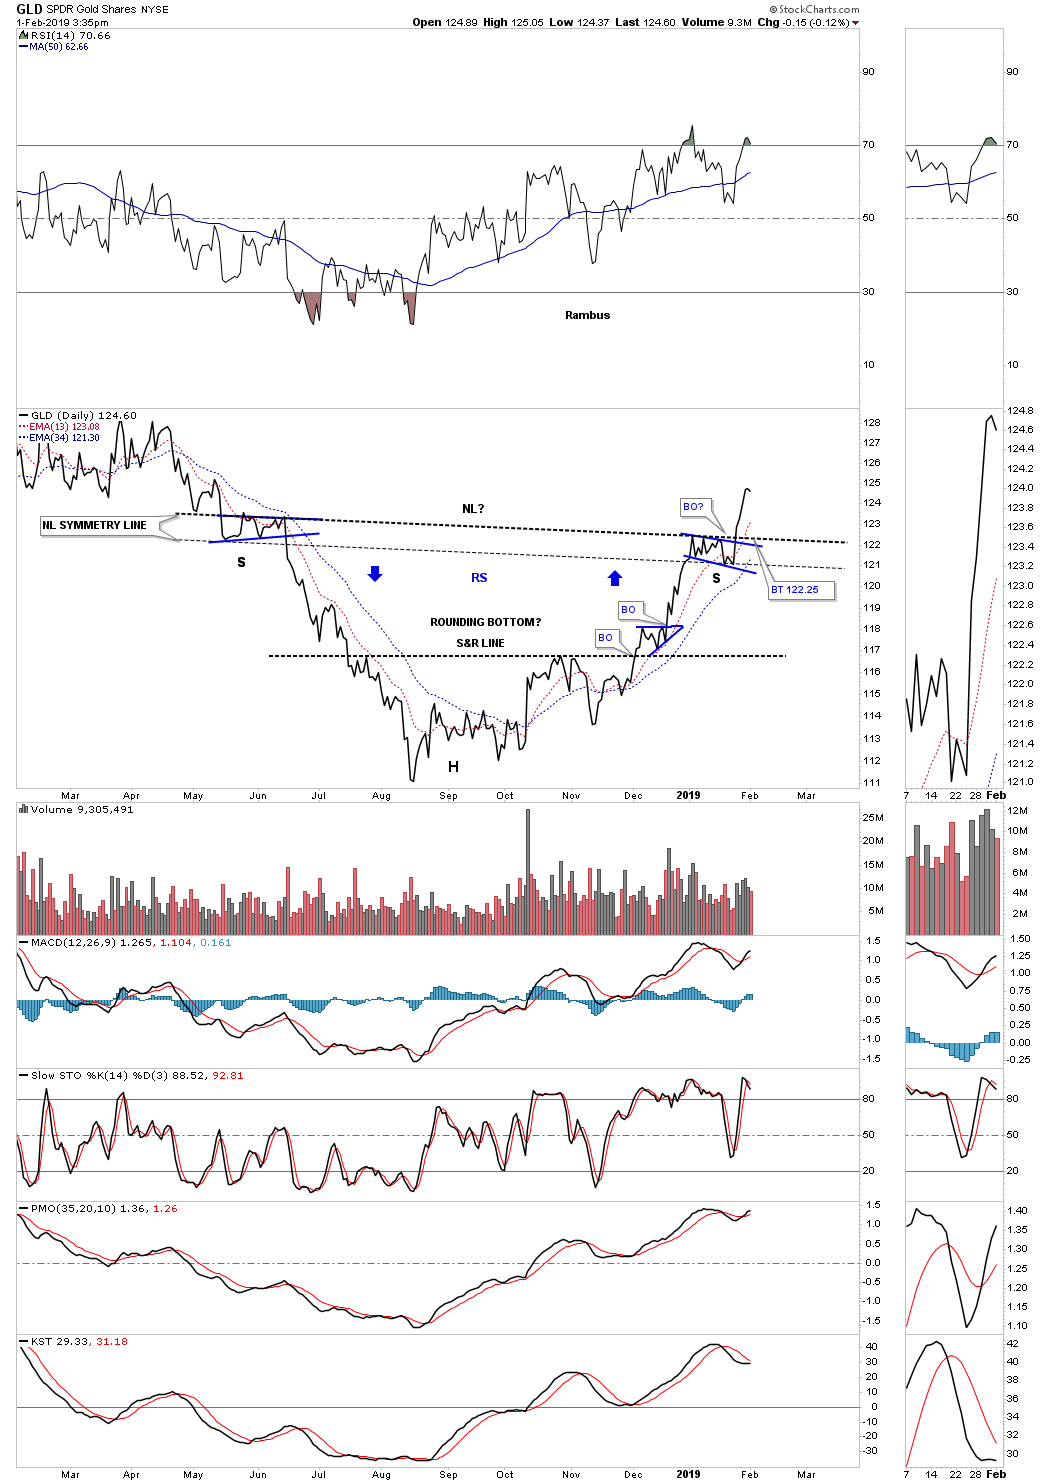
The daily line chart for SPDR Gold Shares (NYSE:GLD) shows we could get a backtest to the neckline around the 122.25 area which would be perfectly normal and actually healthy for the longevity of this move.
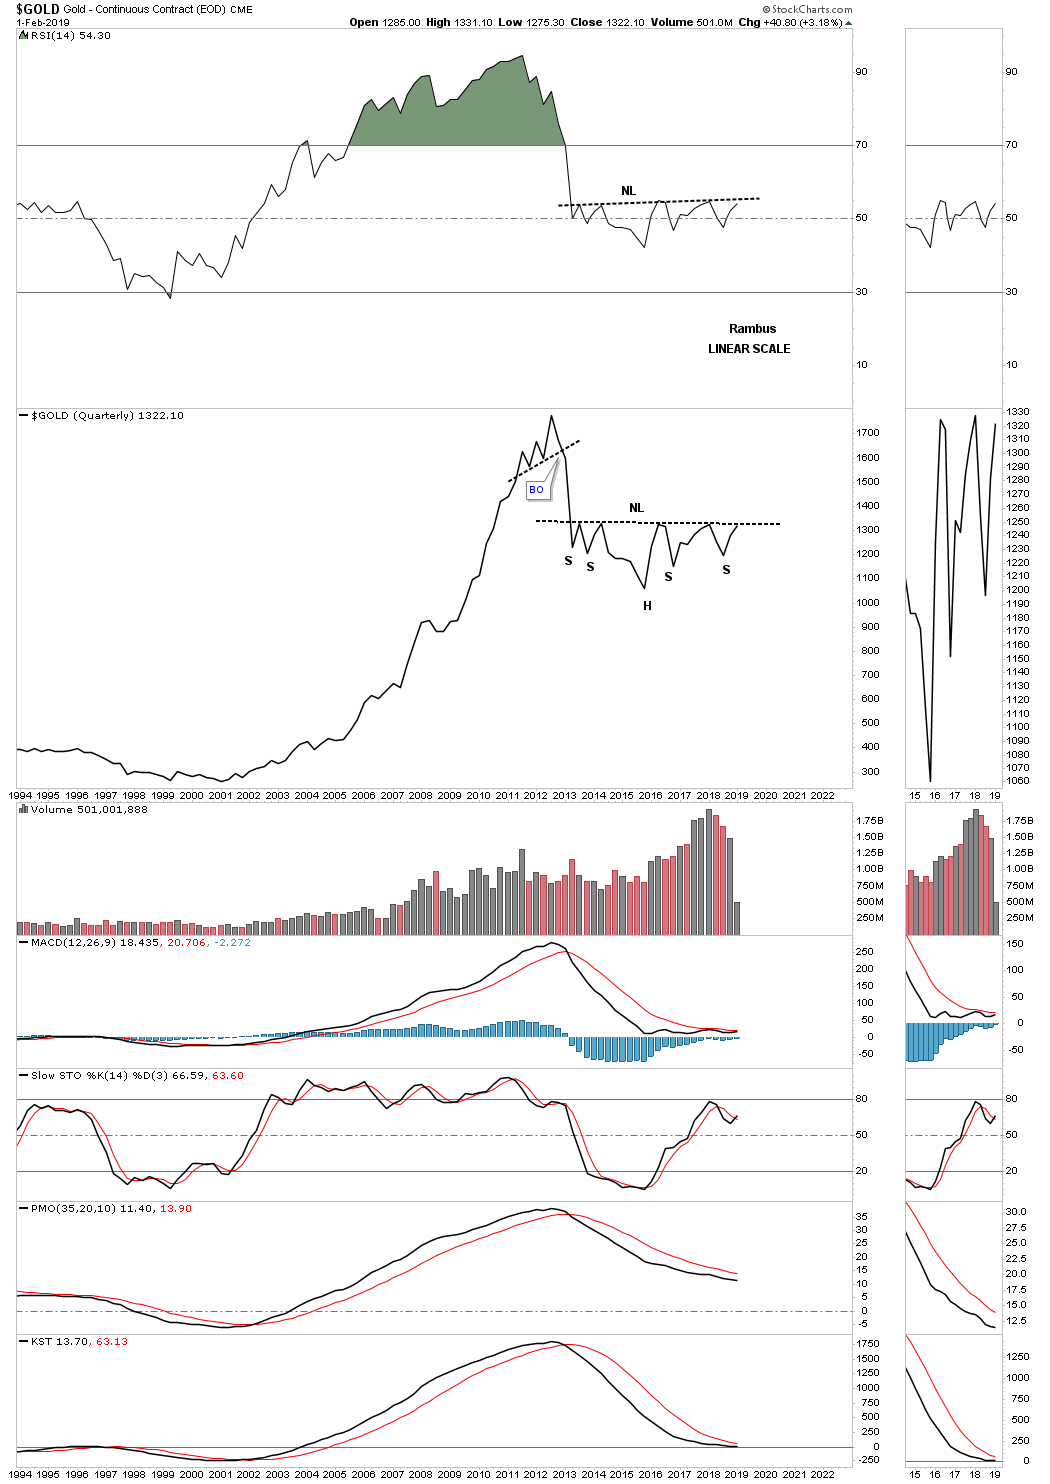
Last week I showed you a long term quarterly line chart for gold which is showing a possible very large H&S bottom that actually started building out during the 2013 crash. It’s another way to cut out the noise and look for big patterns. When you do spot a big pattern on a quarterly line chart you can then look at a monthly chart for more clarity and then fine tune it by looking at a weekly chart
