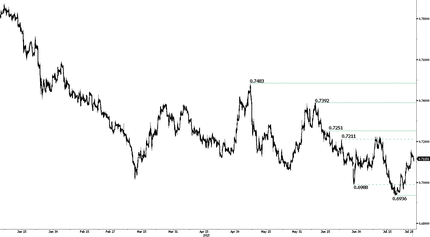
Back to Fundamentals
According to data released today, the UK economy expanded by 0.7% q/q in line with market expectations. Following a soft patch of 0.4% in 1Q the growth is now trending closer to 2015 expectations. The service sector was the bright spot expanding 0.7 q/q. While construction growth was flat, production has supported by output increase in the oil and gas industry. The strong GDP read complements the acceleration in the labor markets and points to further expansion in 3Q. Recent Bank of England meeting minutes acknowledged the solid outlook but the actual prints will provide some relief to hawkish members. This solid read should increase the likelihood that BoE members Weale and McCafferty vote for policy tightening at the August meeting. As the monetary policy divergence theme strengthen, GBP should become one of the primary beneficiaries as expectations for a February 2016 rate hike increase. Currently the BoE seems not really concerned by the GBP strength which should allow GBP to trade higher against EUR and USD. GBP/USD spiked to 1.5589 on the GDP release. GBP/USD should be supported by 1.5483 uptrend channel with a target of range top at 1.5732.
IMF advises ECB to expand its QE:
“The International Monetary Fund issued yesterday its annual report on the Eurozone’s economy. The tone of this report is somewhat alerting as the institution warns about contagion fears, high unemployment and lack of growth in the Eurozone. Also, it is stated that all the necessary tools must be used and ready to deploy to save banks. Hence, the European banking system should continue to have access to liquidity and sovereign debt markets must be maintained in order. Furthermore, it fosters the ECB to expand its quantitative easing (QE) program beyond September 2016. In addition, the IMF is pushing the ECB to use the exact same tools used by the United States since 2008 with the results we are now seeing. In other words, the ECB has to face against lack of growth with monetary tools that have proven to be inefficient to create growth and to avoid deflation. This does not the IMF to forecast a Eurozone GDP Growth of 1.5% this year and 1.7% next year. We remain even more sceptical about those forecasts as unemployment in the Eurozone is still high, averaging around 11% and near 25% in Greece and Spain and we anticipate QE will not have the desired effects. EUR/USD price action is mainly driven by the US this week against a backdrop of FOMC meeting and Q2 GDP. However, we think that European Business confidence as well as start of negotiations for the third Greek Bailout and its uncertainties will provide downside pressure to the pair which is likely to challenge again the 1.1000 level.”

The Risk Today
EUR/USD has decreased and is now holding below 1.1100. Hourly resistance lies at 1.1278 (29/06/2015 high). Stronger resistance lies at 1.1436 (18/06/2015 high). Support can be found at 1.0660 (21/04/2015 low). Over the last month, the pair is setting lower highs therefore we remain bearish. In the longer term, the symmetrical triangle from 2010-2014 favors further weakness towards parity. As a result, we view the recent sideways moves as a pause in an underlying declining trend. Key supports can be found at 1.0504 (21/03/2003 low) and 1.0000 (psychological support). Break to the upside would suggest a test of resistance at 1.1534 (03/02/2015 reaction high).
GBP/USD is now pausing. Hourly resistance is given at 1.5803 (24/06/2015 high). Support is given at the 38.2% Fibonacci retracement at 1.5409. Stronger support is given at 1.5330 (08/07/2015 low). We expect the pair to decrease again within the next few days. In the longer term, the technical structure looks like a recovery bottom whose maximum upside potential is given by the strong resistance at 1.6189 (Fibo 61% entrancement).
USD/JPY is increasing slowly. Stronger resistance still lies at 135.15 (14-year high). Hourly support is given by the 38.2% Fibonacci retracement at 122.04. Stronger support is given at 120.41 (08/07/2015 low). A long-term bullish bias is favored as long as the strong support at 115.57 (16/12/2014 low) holds. A gradual rise towards the major resistance at 135.15 (01/02/2002 high) is favored. A key support can be found at 118.18 (16/02/2015 low).
USD/CHF is still in a short-term upside momentum. Hourly support can be found at 0.9151 (18/06/2015 low). The road is still wide open for the pair to challenge stronger resistance at 0.9719 (23/04/2015 high). The pair is gaining momentum to challenge this resistance. In the long-term, there is no sign to suggest the end of the current downtrend. After failure to break above 0.9448 and reinstate bullish trend. As a result, the current weakness is seen as a counter-trend move. Key support can be found 0.8986 (30/01/2015 low).
Resistance and Support:
EUR/USD1.14361.12781.11961.09421.08191.06601.0521
GBP/USD1.59301.58031.57091.54901.53301.51711.5089
USD/CHF1.01290.98630.97190.96150.92440.91510.9072
USD/JPY135.15125.86124.45123.97120.41118.89116.66
